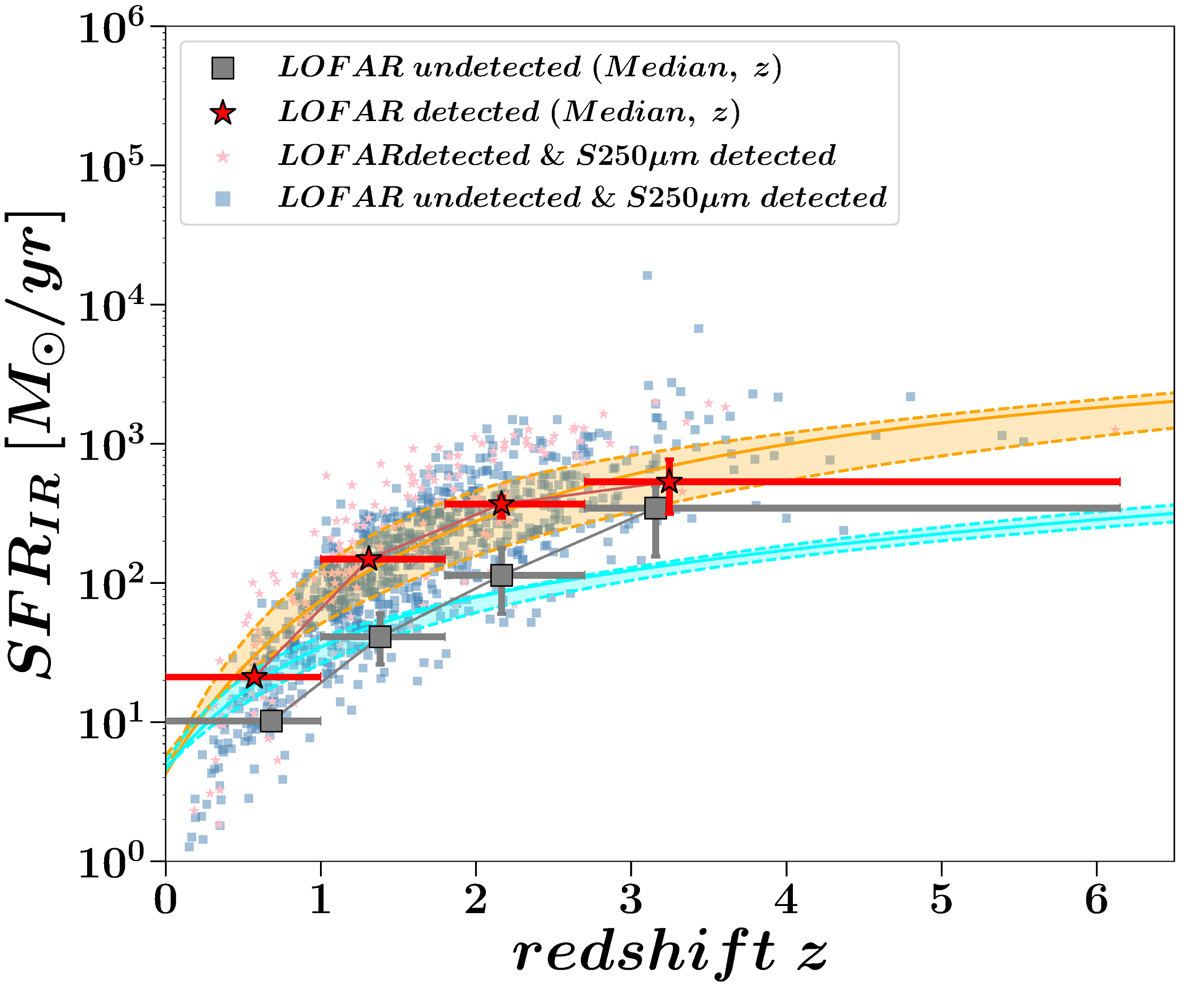
Fig. 13.
Download original image
Infrared star formation rate (SFRIR) of LOFAR radio-detected quasars (RDQs) and LOFAR radio-undetected quasars (RUQs) versus redshift. The filled stars and squares and associated vertical error bars show the median value in each bin. The horizontal error bars indicate the extend of the redshift bins used. The marron stars and cyan squares show the results for the RDQs and RUQs, respectively, with ≥ 2σ SPIRE-250 μm detections. The solid lines represent the predicted SFRs as a function of redshift derived for the median quasars using the star-formation main sequence (SFMS) relation by Schreiber et al. (2015). The cyan and orange shaded regions indicate the uncertainty intervals of the fitting provided by Schreiber et al. (2015). The vertical errror bars indicate the errors of the SFRIR estimates obtained using the SED fitting, while the horizontal errors indicate the size of the redshift intervals considered. There is a good agreement between the measured median SFRIR for RDQs and RUQs, and the SFMS predictions considering the width of the redshift bins employed and the intrinsic scatter of the SFMS relation.
Current usage metrics show cumulative count of Article Views (full-text article views including HTML views, PDF and ePub downloads, according to the available data) and Abstracts Views on Vision4Press platform.
Data correspond to usage on the plateform after 2015. The current usage metrics is available 48-96 hours after online publication and is updated daily on week days.
Initial download of the metrics may take a while.