Fig. 11.
Download original image
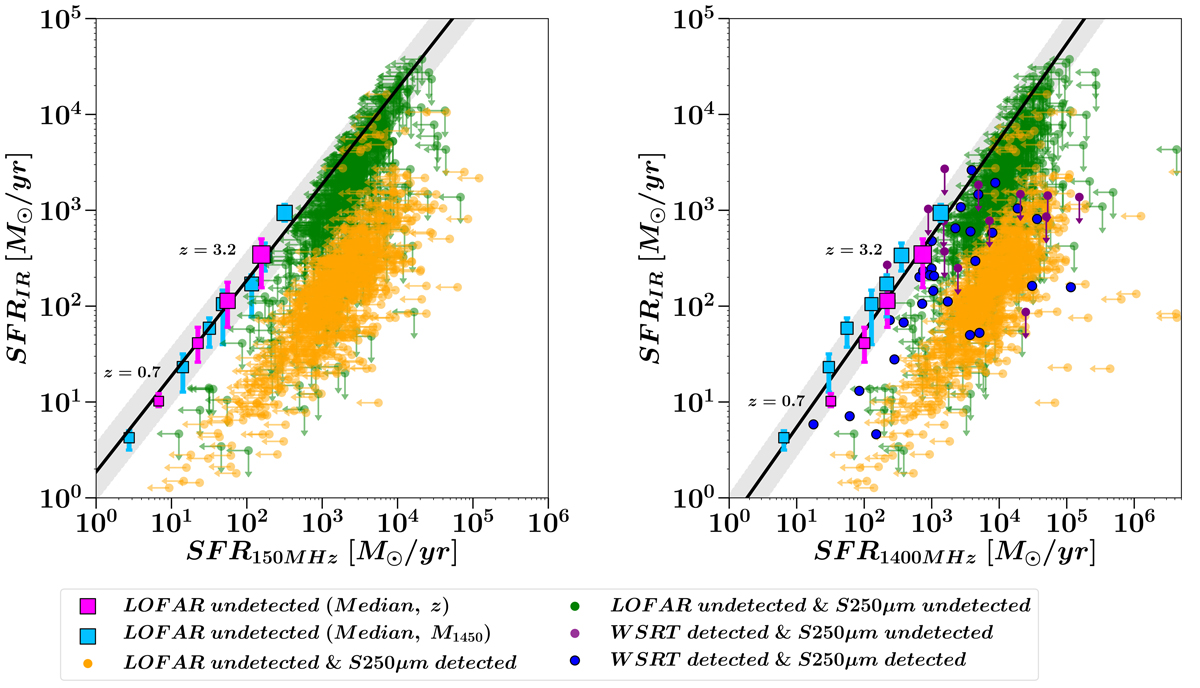
Comparison between star-formation rates (SFRs) derived using infrared and radio data. Left: SFR derived from the infrared luminosity, SFRIR, versus the SFR derived from the radio luminosity at 150 MHz. SFRIR and SFR150 MHz are in units of solar mass per year. The measurements for median LOFAR radio-undetected quasars (RUQs) (fuchsia and cyan squares), RUQs detected by SPIRE at 250 μm (yellow circles), and RUQs undetected by SPIRE at 250 μm (green circles) are showed. Upper limits are indicated by arrows in either SFRIR or SFR150 MHz. For median quasars, the increasing symbol size indicates an increment in the redshift or M1450 absolute luminosity. The dashed line is the far-infrared radio correlation (FIRC) at L150 MHz derived by Calistro-Rivera et al. (2017). The gray shaded region indicates the spread of the FIRC scaled by a factor of ±2. The text indicates the median redshift of the first and last redshift bins of the stacking according to redshift. Right: Same as the right panel, but for the SFR at 1400 MHz, SFR1400 MHz. The measurements for RUQs detected by WSRT, but undetected by SPIRE at 250 μm (purple circles); and RUQs detected by both SPIRE and WSRT at 250 μm and 1400 MHz (blue circles), respectively are also displayed.
Current usage metrics show cumulative count of Article Views (full-text article views including HTML views, PDF and ePub downloads, according to the available data) and Abstracts Views on Vision4Press platform.
Data correspond to usage on the plateform after 2015. The current usage metrics is available 48-96 hours after online publication and is updated daily on week days.
Initial download of the metrics may take a while.