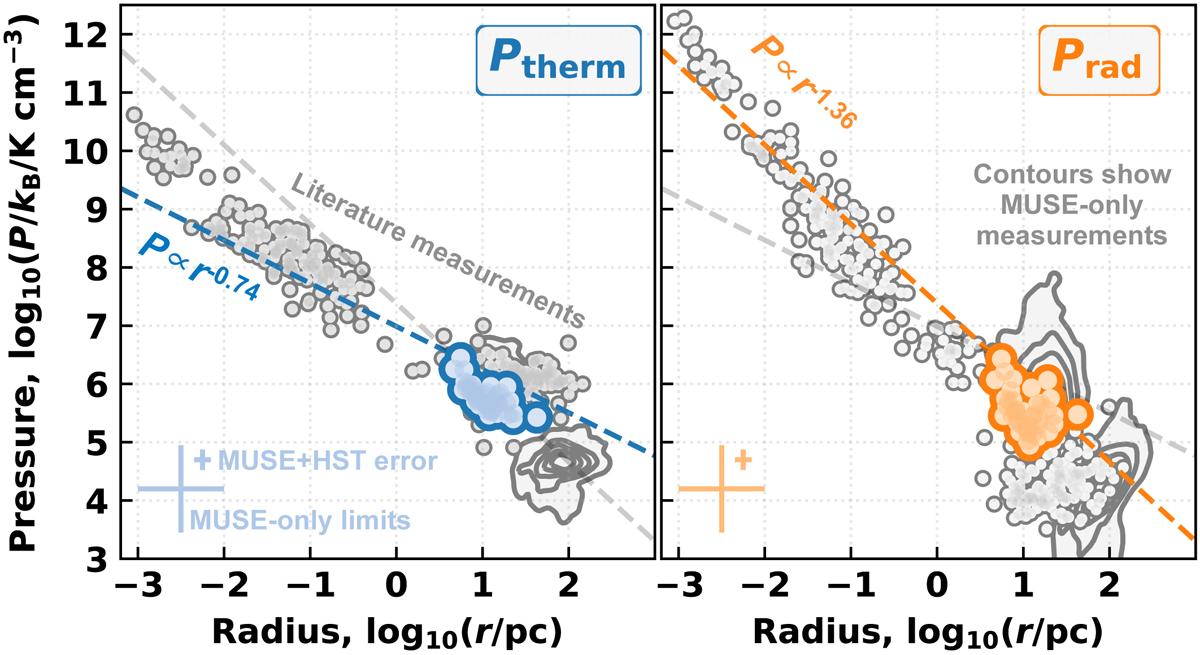
Fig. 6.
Download original image
Thermal (left panel) and direct radiation (right panel) pressure terms. Coloured points are H II regions studied in this work, grey points are measurements from the literature (Lopez et al. 2014; McLeod et al. 2019, 2020, 2021; Barnes et al. 2020; Olivier et al. 2021), and the contours show the upper and lower limits for all galaxies studied by Barnes et al. (2021). The dashed lines show the power law relations from Olivier et al. (2021).
Current usage metrics show cumulative count of Article Views (full-text article views including HTML views, PDF and ePub downloads, according to the available data) and Abstracts Views on Vision4Press platform.
Data correspond to usage on the plateform after 2015. The current usage metrics is available 48-96 hours after online publication and is updated daily on week days.
Initial download of the metrics may take a while.