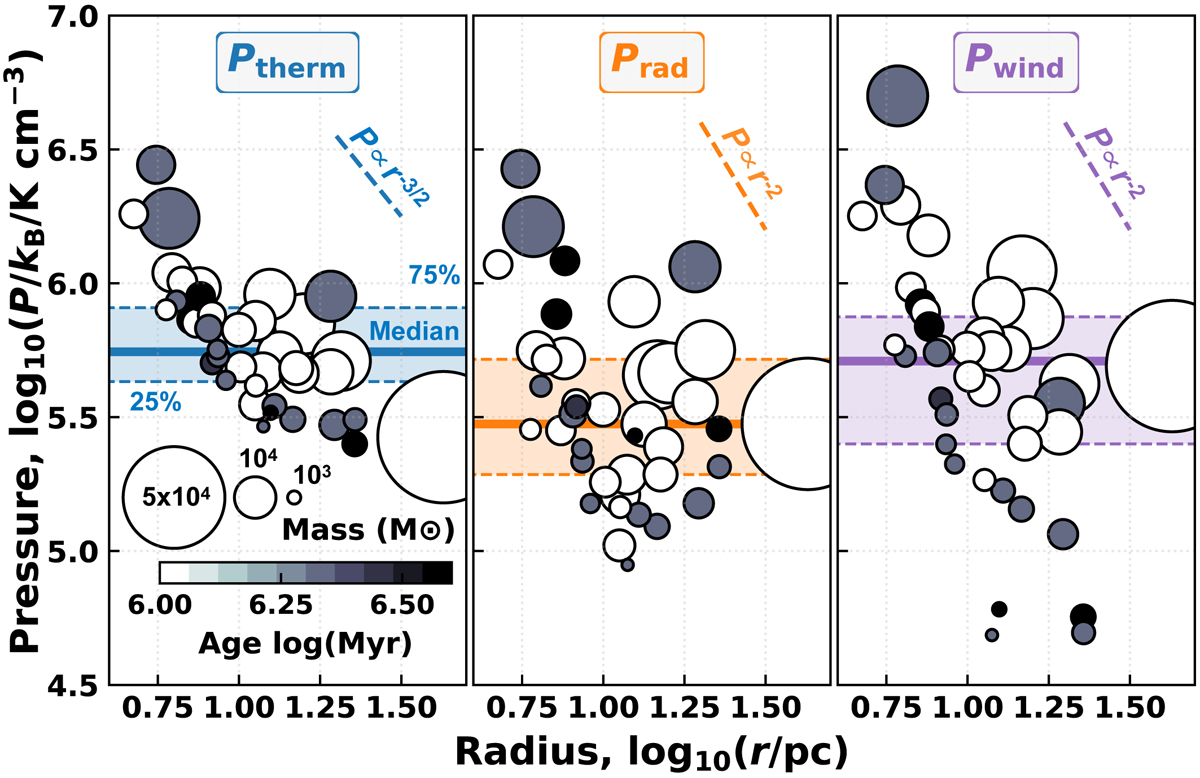
Fig. 3.
Download original image
Distribution of the pressures due to the various feedback mechanisms as a function of H II region radius, as well as stellar population mass (circle size) and age (circle colour). We show a key for the size (i.e. mass) and a colour bar denoting the age at the bottom of the left panel. The horizontal lines show the 25, 50 (median), and 75 percentiles for each pressure. The intrinsic relations of each pressure term are shown as a short dashed line in the upper right of each panel.
Current usage metrics show cumulative count of Article Views (full-text article views including HTML views, PDF and ePub downloads, according to the available data) and Abstracts Views on Vision4Press platform.
Data correspond to usage on the plateform after 2015. The current usage metrics is available 48-96 hours after online publication and is updated daily on week days.
Initial download of the metrics may take a while.