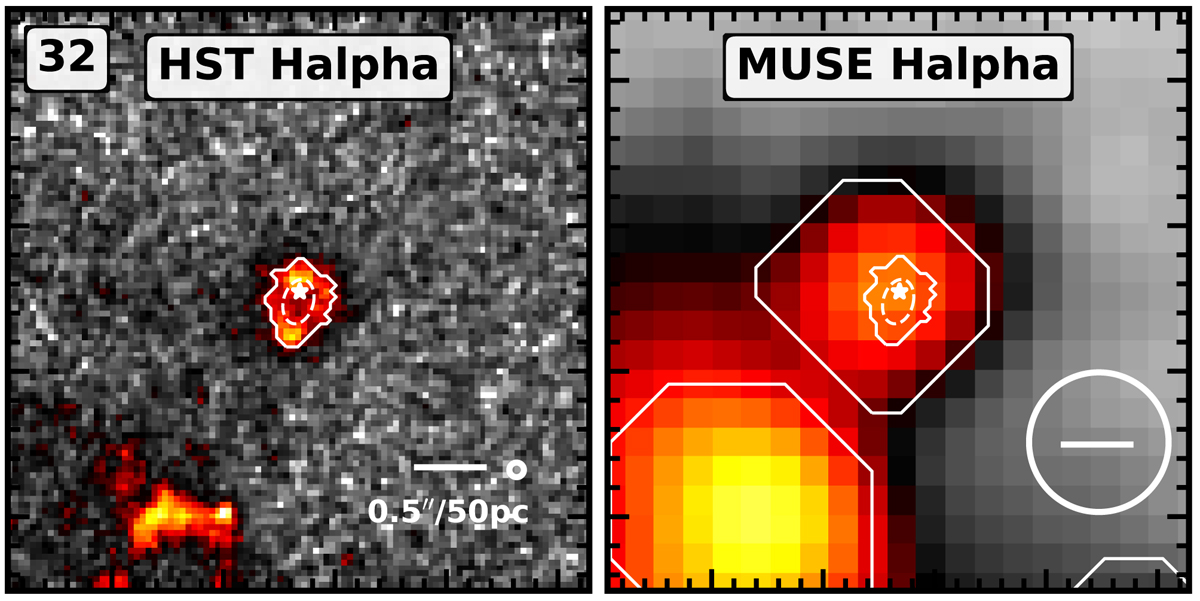
Fig. 2.
Download original image
Comparison between the HST and MUSE observations towards one of the H II regions in our sample. HST Hα narrowband emission overlaid with a contour outlining the isophotal boundary as defined from our dendrogram analysis, shown on the left. We show the intensity-weighted second order moment of the structure within this boundary as a dashed ellipse, which we use to define the radius of the H II region (Sect. 3.1). A star marks the position of the identified ionising stellar population (Sect. 3.2). The region ID is shown in the upper left (Table A.1). Hα emission observed with MUSE (Emsellem et al. 2022), overlaid with white contours showing the boundaries of sources identified as part of the nebula catalogue from Santoro et al. (2022), shown on the right. In the lower right of each panel, we show a scale bar and a circle denoting the approximate PSF size.
Current usage metrics show cumulative count of Article Views (full-text article views including HTML views, PDF and ePub downloads, according to the available data) and Abstracts Views on Vision4Press platform.
Data correspond to usage on the plateform after 2015. The current usage metrics is available 48-96 hours after online publication and is updated daily on week days.
Initial download of the metrics may take a while.