Fig. 1.
Download original image
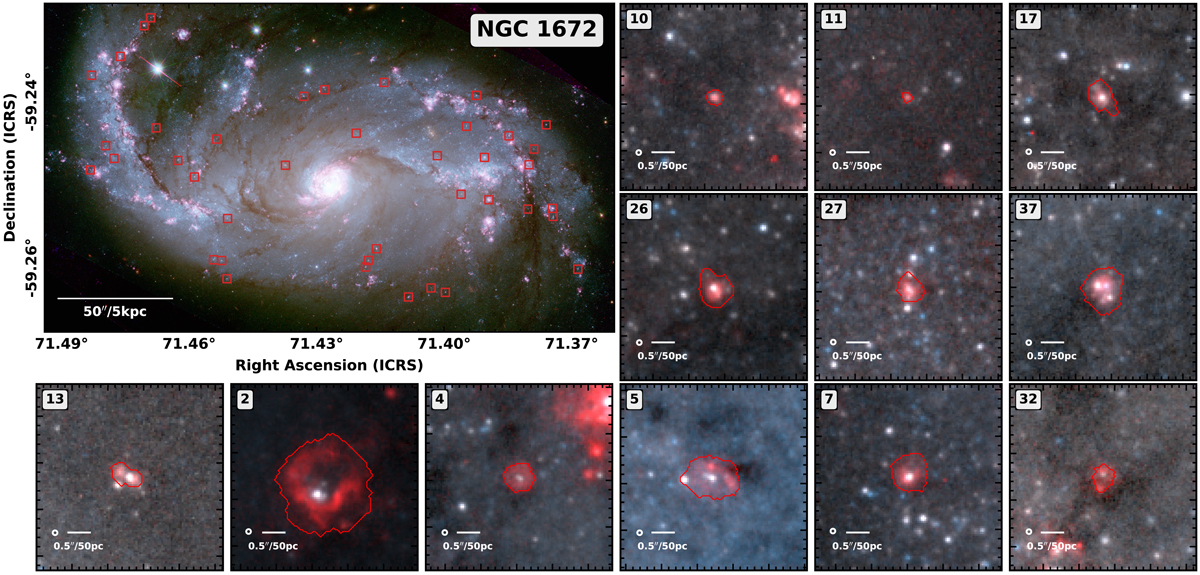
H II regions identified towards NGC 1672. The three colour images are composed of 814 nm, 555 nm, and 435 nm wideband filters from the HST (Jenkins et al. 2011; Lee et al. 2022); and in red, we display the HST continuum-subtracted 658 nm (Hα) narrow-band emission (Jenkins et al. 2011). Map of the galaxy disc overlaid with the boxes showing the positions of the H II region sample (upper left). Image cutouts for a subset of the H II regions (right and below). The region ID is shown in the upper left of each panel (Table A.1). Overlaid as a red contour is the boundary of each H II region (Sect. 3.1). At the lower left of each panel, we show a scale bar, and a circle denoting the approximate HST PSF size (0.1″, 9 pc).
Current usage metrics show cumulative count of Article Views (full-text article views including HTML views, PDF and ePub downloads, according to the available data) and Abstracts Views on Vision4Press platform.
Data correspond to usage on the plateform after 2015. The current usage metrics is available 48-96 hours after online publication and is updated daily on week days.
Initial download of the metrics may take a while.