Fig. 6
Download original image
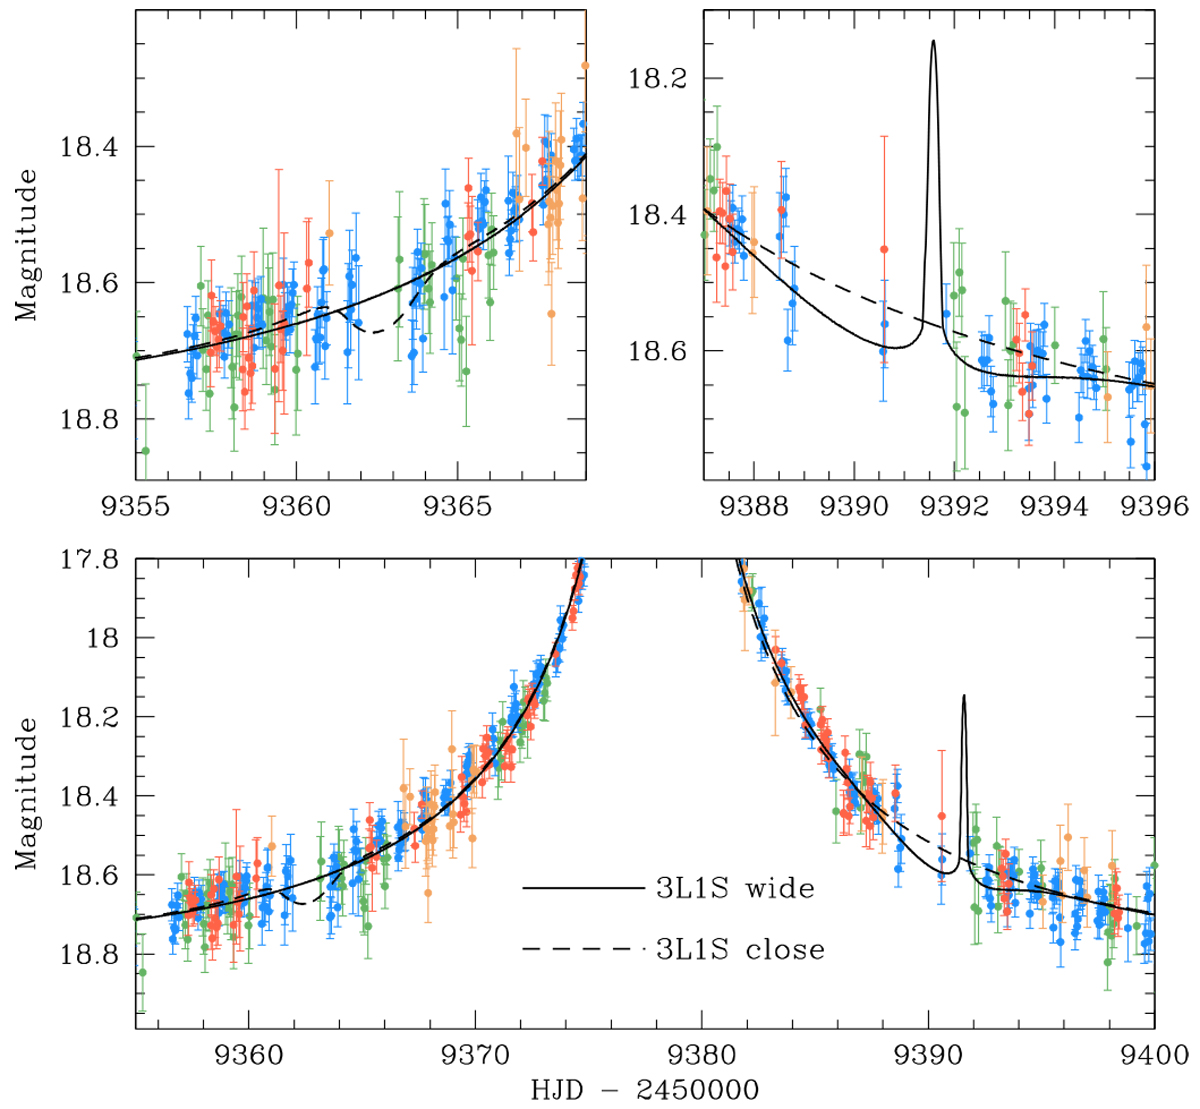
Enlarged view of the light curve around the regions of the planetary-caustic induced anomalies predicted by the close (upper left panel) and wide (upper right panel) models. The bottom panel shows a zoomed-out view of the light curve at low magnification. The solid and dashed curves drawn over the data points are the wide and close 3L1S models, respectively.
Current usage metrics show cumulative count of Article Views (full-text article views including HTML views, PDF and ePub downloads, according to the available data) and Abstracts Views on Vision4Press platform.
Data correspond to usage on the plateform after 2015. The current usage metrics is available 48-96 hours after online publication and is updated daily on week days.
Initial download of the metrics may take a while.