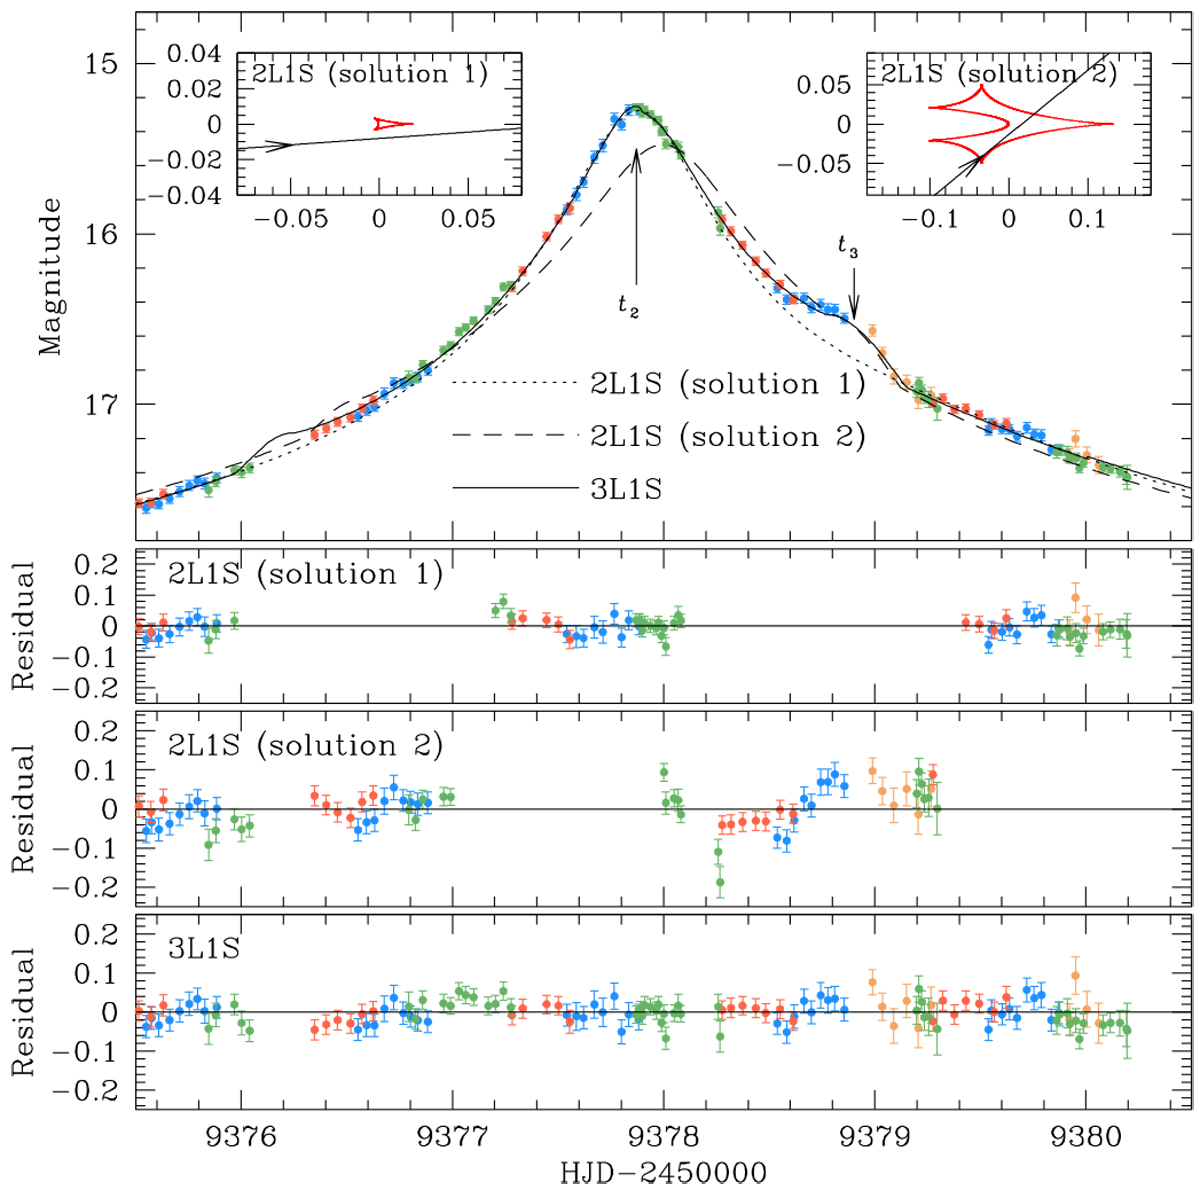
Fig. 3
Download original image
Models and residuals of the “solution 1” and “solution 2” 2L1S models. The individual solutions are obtained from the two sets of 2L1S models, in which the light curve was fitted by excluding the data lying in the regions of 9376.0 < HID′ < 9377.2 and 9378.2 < HID′ < 9379.4 for solution 1, and by excluding those lying in the regions of 9377.0 < HID′ < 9378.0 and 9379.3 < HID′ < 9381.0 for solution 2. The two insets in the top panel show the lens system configurations of the individual solutions. Also presented are the model curve and residual of the 3L1S solution.
Current usage metrics show cumulative count of Article Views (full-text article views including HTML views, PDF and ePub downloads, according to the available data) and Abstracts Views on Vision4Press platform.
Data correspond to usage on the plateform after 2015. The current usage metrics is available 48-96 hours after online publication and is updated daily on week days.
Initial download of the metrics may take a while.