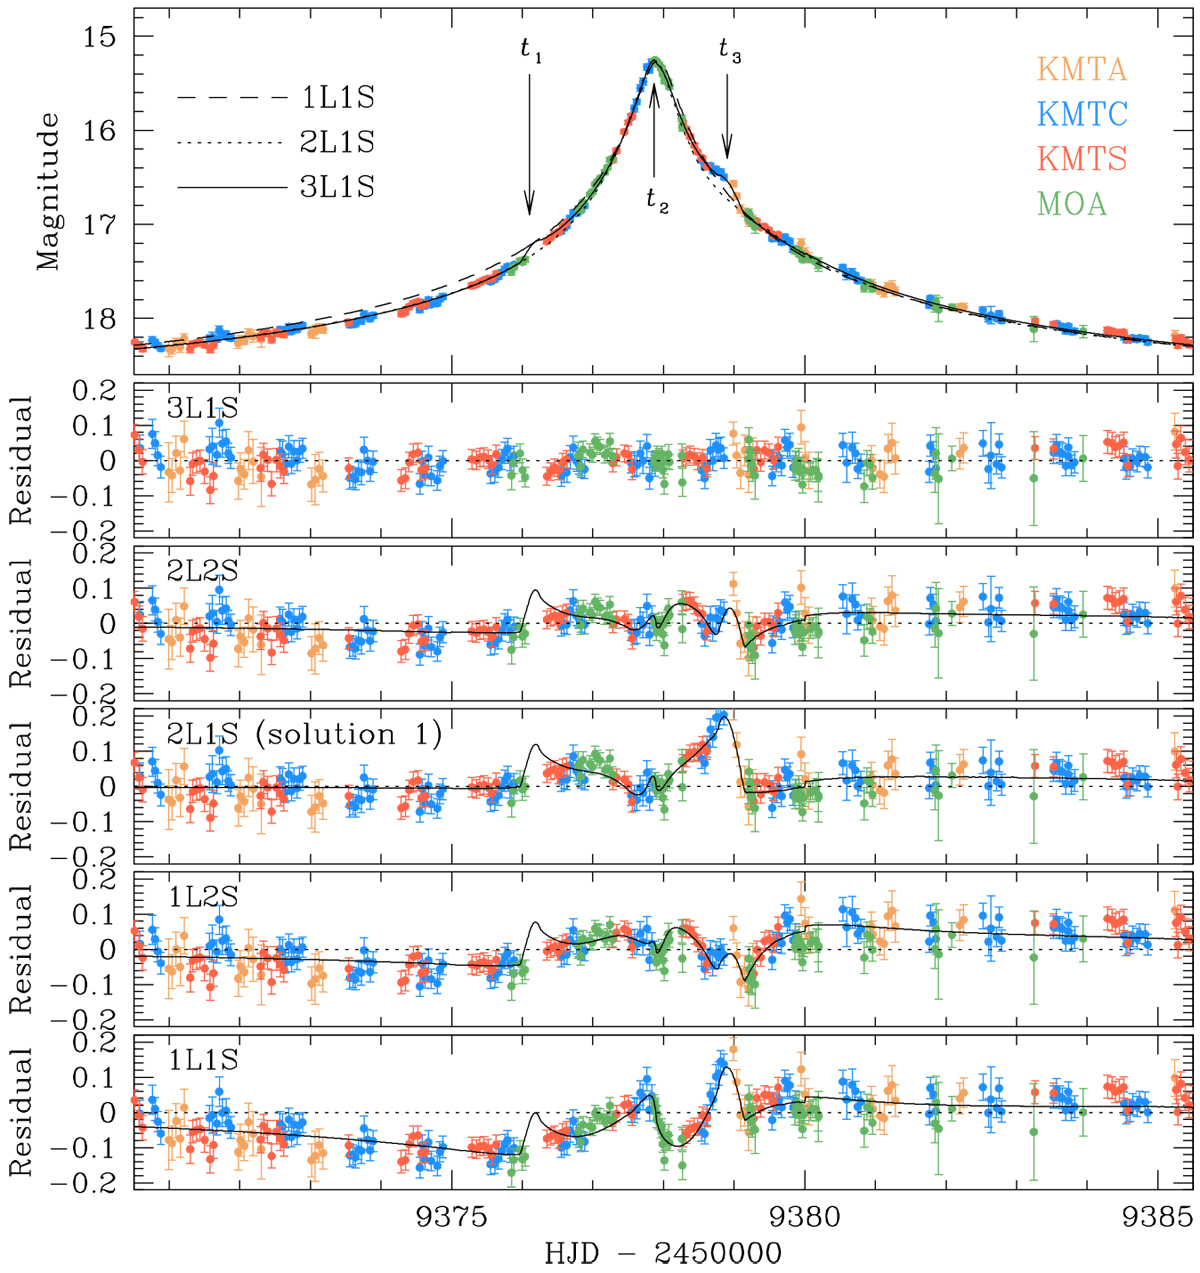
Fig. 2
Download original image
Zoom-in view around the peak of the light curve. The lower five panels show the residuals of the tested models under 3L1S, 2L2S, 2L1S, 1L2S, and 1L1S interpretations. The curve drawn in each residual panel is the difference from the 3L1S model. The curves of the 1L1S, 2L1S, and 3L1S models are drawn over the data points of the light curve in the top panel. The epochs marked t1; t2, and t3 indicate the times of the major anomalous features.
Current usage metrics show cumulative count of Article Views (full-text article views including HTML views, PDF and ePub downloads, according to the available data) and Abstracts Views on Vision4Press platform.
Data correspond to usage on the plateform after 2015. The current usage metrics is available 48-96 hours after online publication and is updated daily on week days.
Initial download of the metrics may take a while.