Fig. 1
Download original image
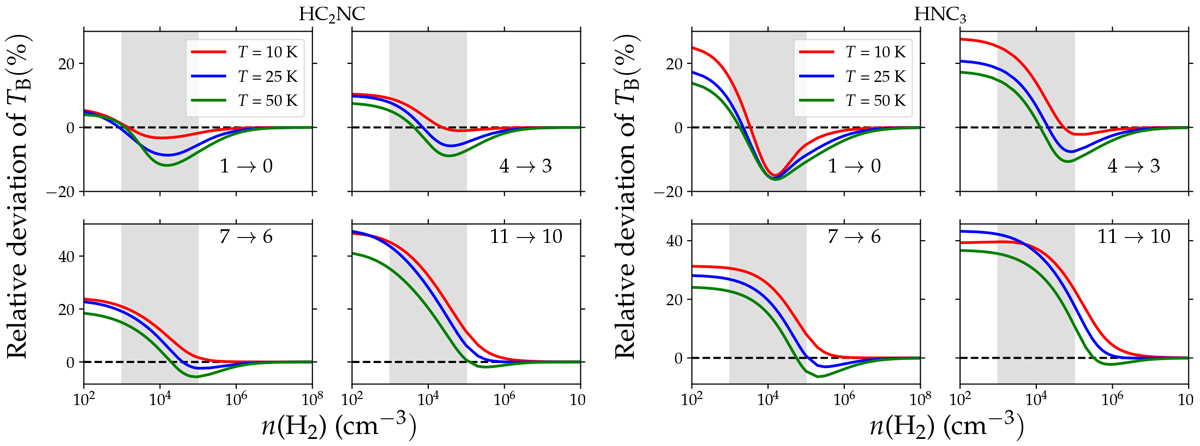
Relative deviation of iB upon Model (2) compared to Model (3) (see text for the description of the models) as a function of the H2 volume density for selected temperatures and transitions. We note that HC2NC and HNC3 are represented in the left and right panels, respectively. These data were calculated for fixed column densities of 1012 cm−2. The grey band delimits the region where 104 ≤ n (cm−3) ≤ 5 × 10⁴.
Current usage metrics show cumulative count of Article Views (full-text article views including HTML views, PDF and ePub downloads, according to the available data) and Abstracts Views on Vision4Press platform.
Data correspond to usage on the plateform after 2015. The current usage metrics is available 48-96 hours after online publication and is updated daily on week days.
Initial download of the metrics may take a while.