Fig. 7
Download original image
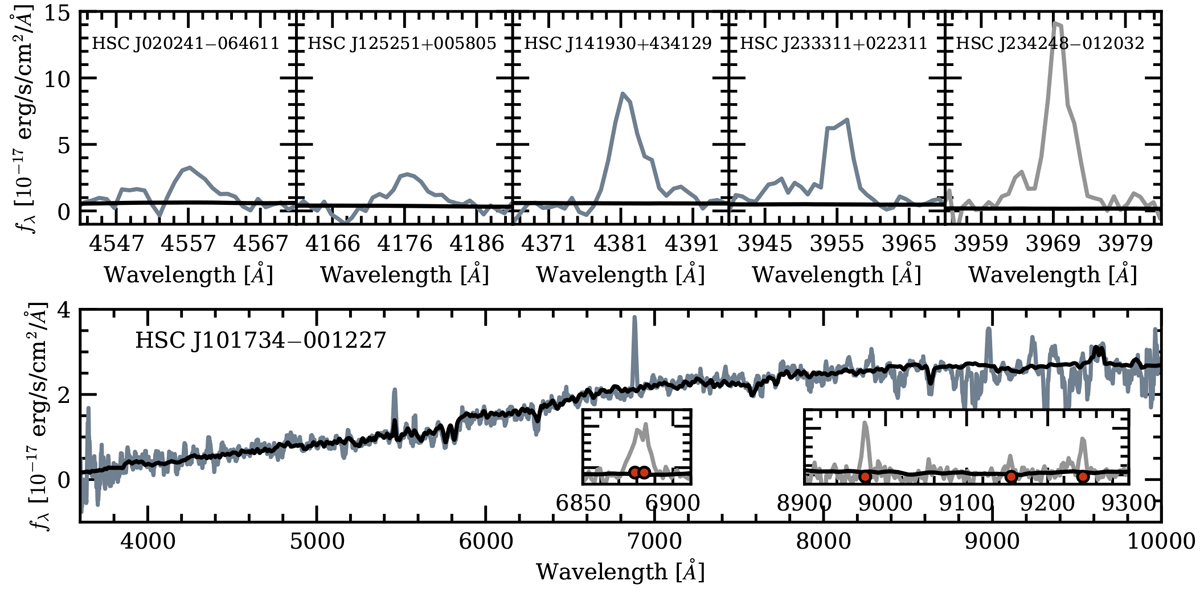
SDSS spectra of the six strong-lens candidates with evidence of higher-redshift emission lines. In each panel, the grey line represents the observed spectrum and the black line represents the SDSS-provided best-fit model spectrum (only for the foreground lens galaxy). The top row shows 30 Å windows centred on the detected emission line for HSC J020241−064611, HSC J125251+005805, HSC J141930+434129, HSC J233311 +022311, and HSC J234248−012032, and the bottom row shows the full optical spectrum for HSC J101734−001227. Several emission lines not associated with the redshift of the foreground galaxy (i.e. z = 0.4647) are shown in the zoomed-in images in the insets of the bottom panel. They are found to be coincident with the locations of [O II] doublet, Hβ, [O III] 4960, and [O III] 5008 at z = 0.8457.
Current usage metrics show cumulative count of Article Views (full-text article views including HTML views, PDF and ePub downloads, according to the available data) and Abstracts Views on Vision4Press platform.
Data correspond to usage on the plateform after 2015. The current usage metrics is available 48-96 hours after online publication and is updated daily on week days.
Initial download of the metrics may take a while.