Fig. 6
Download original image
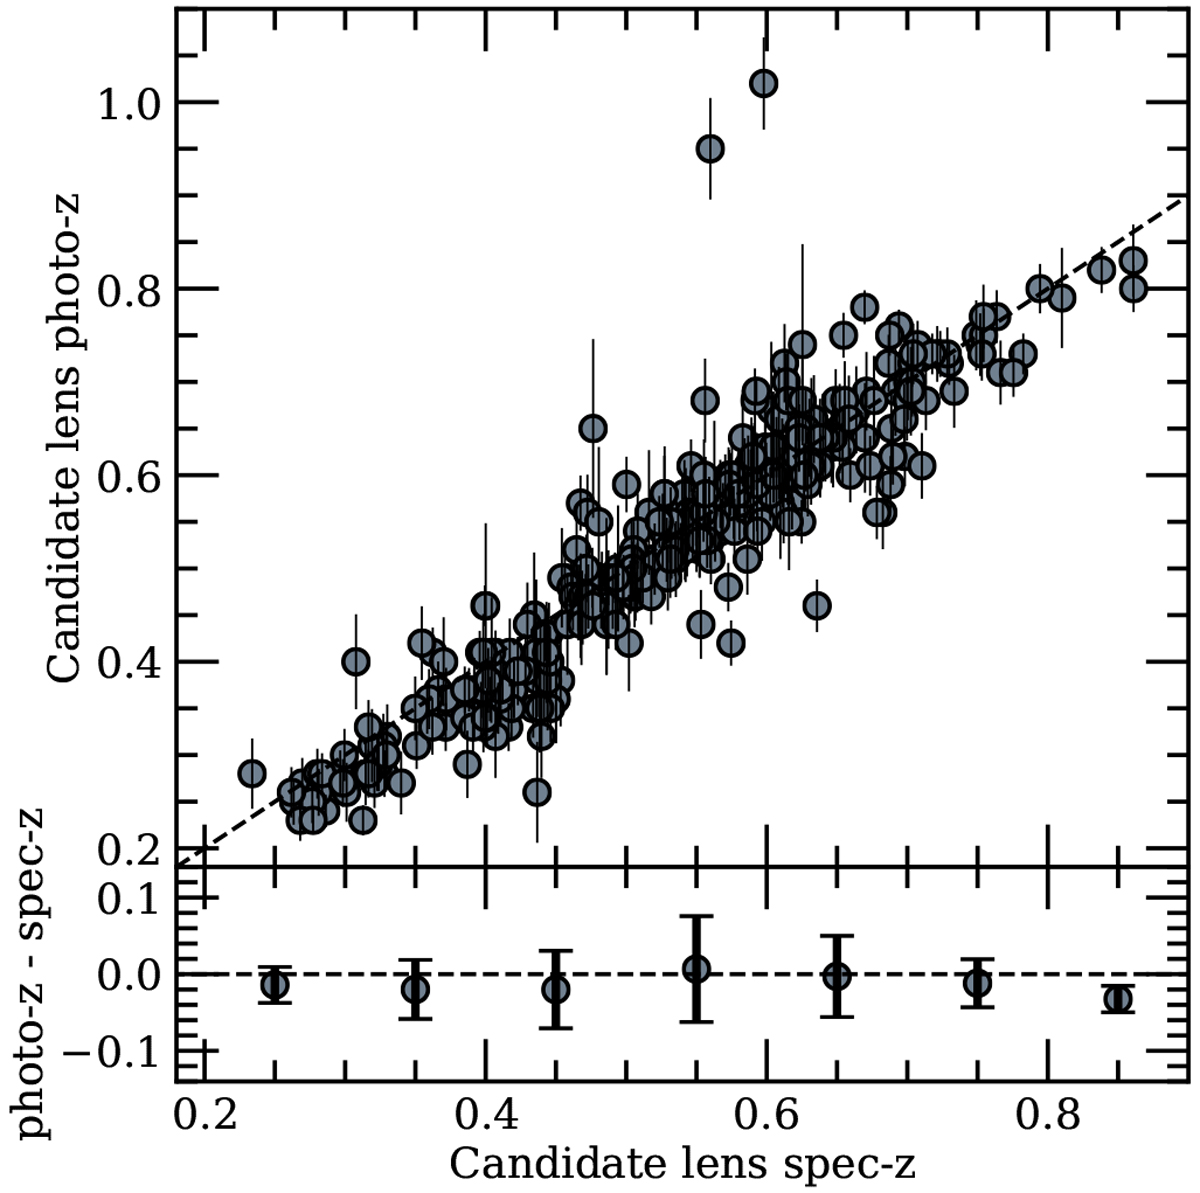
Comparison between photometric redshifts and spectroscopic redshifts for 333 candidate lens galaxies that have measured spectroscopic redshifts (Top). The dashed black line is the one-to-one line. The mean and standard deviation of the differences between photometric redshifts and spectroscopic redshifts in seven redshift bins are shown in the bottom panel.
Current usage metrics show cumulative count of Article Views (full-text article views including HTML views, PDF and ePub downloads, according to the available data) and Abstracts Views on Vision4Press platform.
Data correspond to usage on the plateform after 2015. The current usage metrics is available 48-96 hours after online publication and is updated daily on week days.
Initial download of the metrics may take a while.