Fig. 3
Download original image
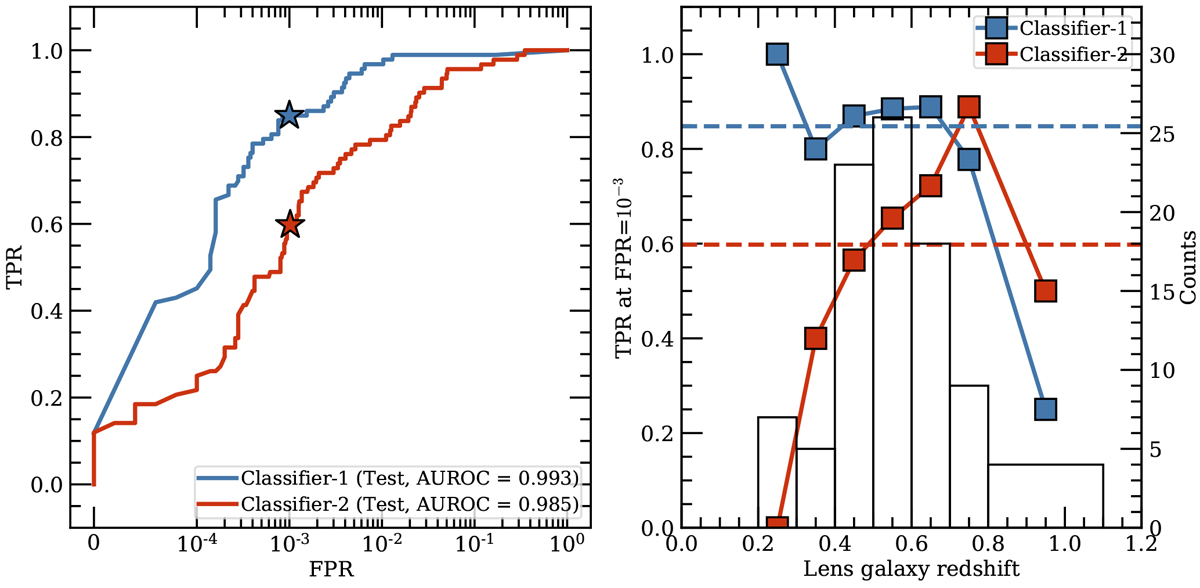
Performances of the two classifiers. Left: ROC curves based on the test sets for Classifier-1 (blue) and Classifier-2 (red). The x-axis is scaled such that 0−l0−4 is in a linear scale and 10−4−1 is in a logarithmic scale. The two star symbols correspond to FPR = 10−3. Right: TPR at an FPR of 10−3 as a function of lens galaxy redshift for Classifier-1 (blue) and Classifier-2 (red). The dashed lines indicate the overall TPRs of 0.85 and 0.60 for Classifier-1 and Classifier-2, respectively. Due to the small sample size, the last redshift bin is chosen to be 0.8–1.1. A histogram of the lens galaxy redshifts of the 92 SuGOHI strong-lens candidates in the test set is also shown (black).
Current usage metrics show cumulative count of Article Views (full-text article views including HTML views, PDF and ePub downloads, according to the available data) and Abstracts Views on Vision4Press platform.
Data correspond to usage on the plateform after 2015. The current usage metrics is available 48-96 hours after online publication and is updated daily on week days.
Initial download of the metrics may take a while.