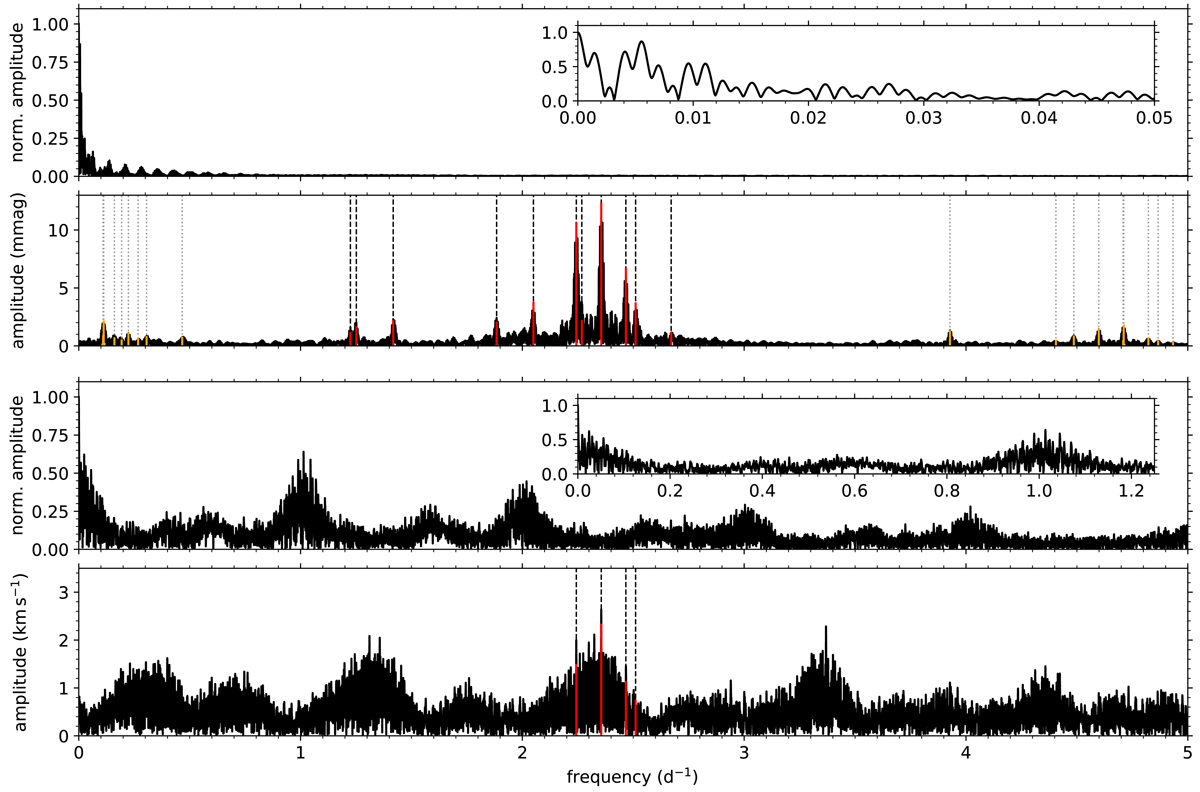
Fig. 5.
Download original image
Lomb-Scargle periodograms of the full TESS light curve (top two panels) and the 1st moments calculated from the LSD profiles (bottom two panels), with the spectral windows of both data sets. 1stpanel: spectral window of the full TESS light curve, with a zoom-in shown in the inset axes. 2ndpanel: Lomb-Scargle periodogram of the full TESS light curve (black) with the corresponding prewhitened pulsation frequencies with S/N ≥ 5.6. The red and dashed black lines mark independent g-mode pulsations. The orange and dotted lines indicate the combination frequencies. 3rdpanel: spectral window of the 1st moments, with a zoom-in shown in the inset axes. 4thpanel: Lomb-Scargle periodogram of the 1st moments (black) with the corresponding prewhitened pulsation frequencies with S/N ≥ 4.0. The red and dashed black lines mark independent g-mode pulsations.
Current usage metrics show cumulative count of Article Views (full-text article views including HTML views, PDF and ePub downloads, according to the available data) and Abstracts Views on Vision4Press platform.
Data correspond to usage on the plateform after 2015. The current usage metrics is available 48-96 hours after online publication and is updated daily on week days.
Initial download of the metrics may take a while.