Free Access
Fig. 3.
Download original image
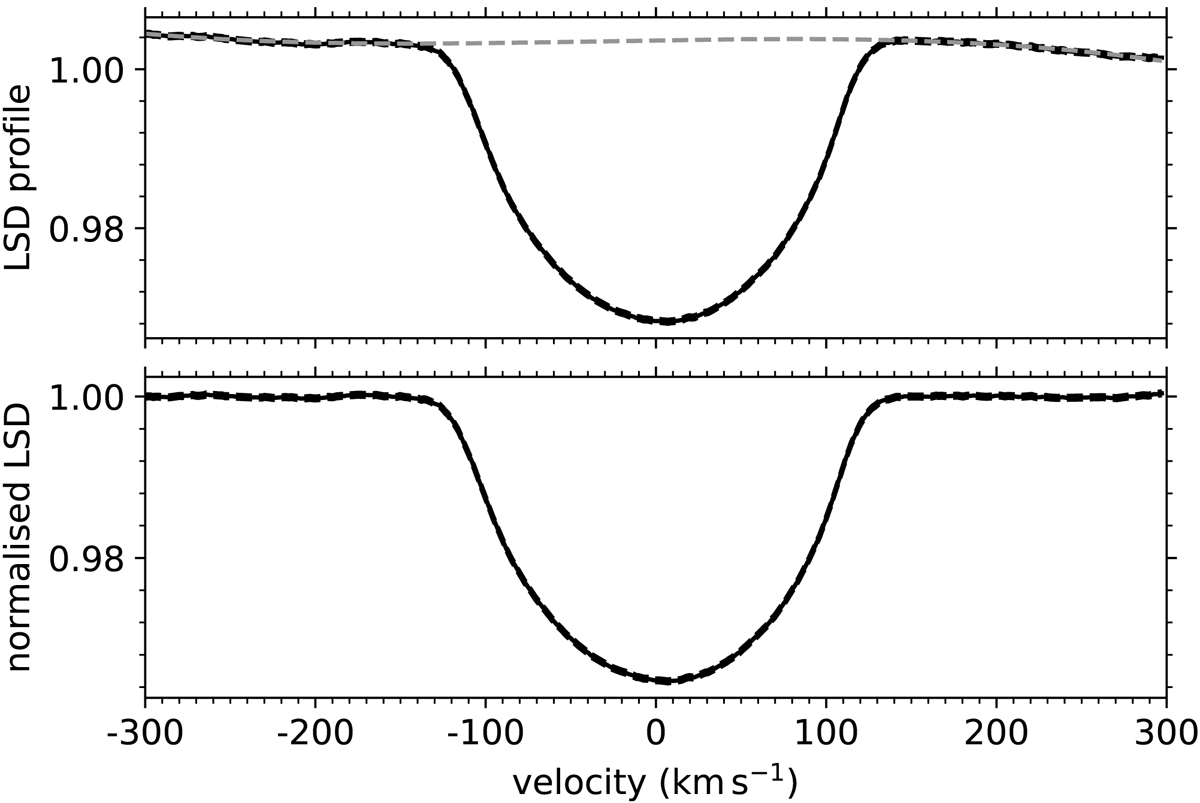
Illustration of the continuum normalisation of the LSD profiles. Top: average LSD profile of the HERMES spectra (full black line) with its error margins (black dashed line). The dashed grey line indicates the 3rd-order polynomial used to renormalise the LSD profile. Bottom: the resulting renormalised LSD profile.
Current usage metrics show cumulative count of Article Views (full-text article views including HTML views, PDF and ePub downloads, according to the available data) and Abstracts Views on Vision4Press platform.
Data correspond to usage on the plateform after 2015. The current usage metrics is available 48-96 hours after online publication and is updated daily on week days.
Initial download of the metrics may take a while.