Fig. 6
Download original image
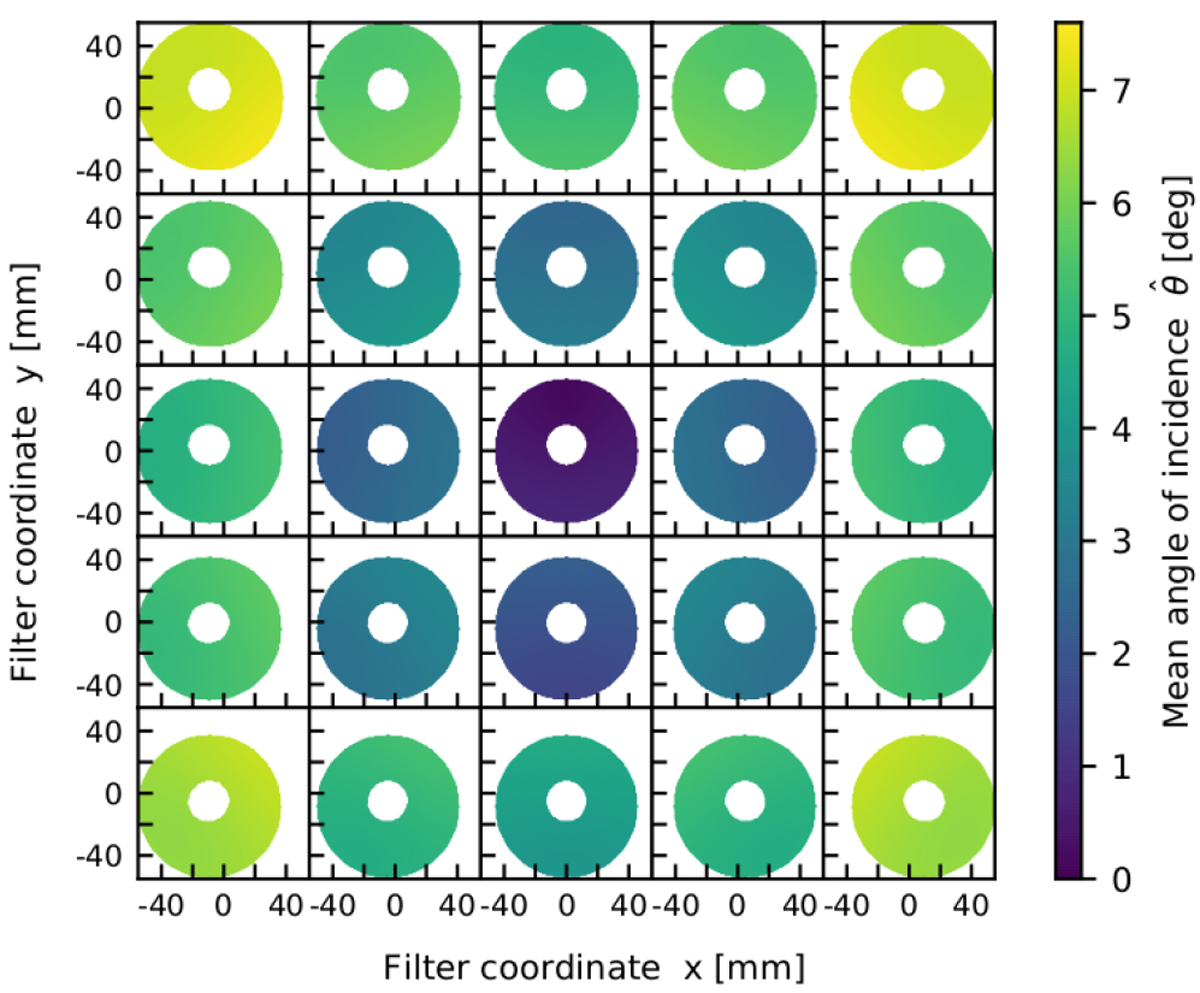
Mean AOI, ![]() , computed from the AOI on the front and back filter side, for different footprint positions on the filter surface. The coordinate squares represent the largest area on the filter within which the footprint can move: footprints displayed at the grid corners correspond to the corners of the FPA. The linear obstructions by the three spider arms – holding the secondary mirror – are too thin to be seen in this representation. We actually worked with a 9 × 9 grid, but for this figure every second row and column was omitted for clarity.
, computed from the AOI on the front and back filter side, for different footprint positions on the filter surface. The coordinate squares represent the largest area on the filter within which the footprint can move: footprints displayed at the grid corners correspond to the corners of the FPA. The linear obstructions by the three spider arms – holding the secondary mirror – are too thin to be seen in this representation. We actually worked with a 9 × 9 grid, but for this figure every second row and column was omitted for clarity.
Current usage metrics show cumulative count of Article Views (full-text article views including HTML views, PDF and ePub downloads, according to the available data) and Abstracts Views on Vision4Press platform.
Data correspond to usage on the plateform after 2015. The current usage metrics is available 48-96 hours after online publication and is updated daily on week days.
Initial download of the metrics may take a while.