Fig. 12
Download original image
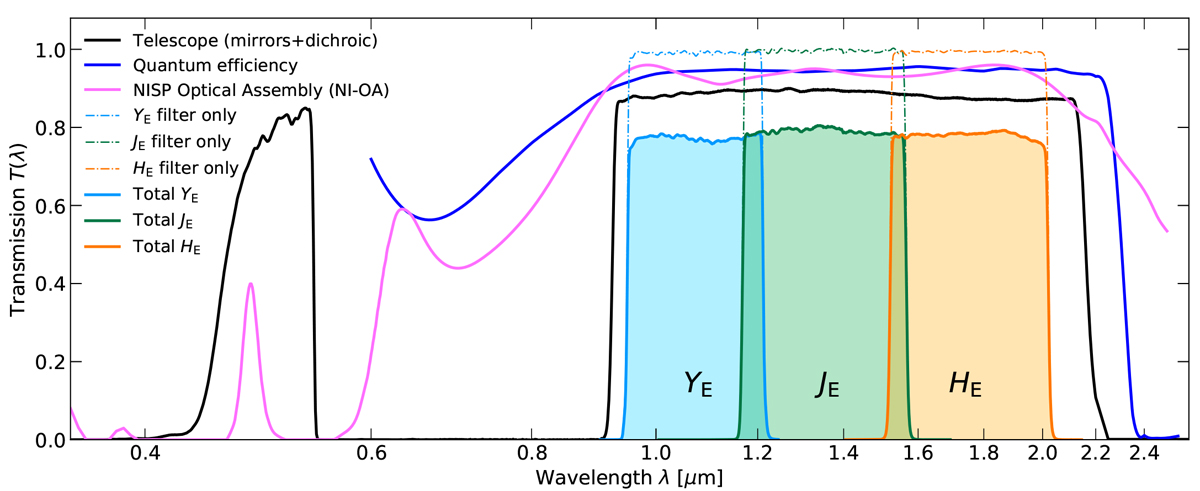
Transmission of elements in the NISP optical path. The telescope component (black line) contains all mirrors and the dichroic; the latter redirects the 0.54–0.93 µm range to VIS and cuts off at 2.15 µm. The pink line shows the transmission of the NI-OA. The blue line shows the interpolated mean detector QE, originally measured at 50 nm intervals. The thin lines show the effective filter transmission integrated over the beam footprint, and the shaded areas the total response (accounting for the filter, telescope, NI-OA, and QE). The residual optical transmission from the dichroic and the NI-OA between 0.45 and 0.54 µm is fully suppressed by the filters’ out-of-band blocking (see Fig. 13). These curves do not include effects from particulate contamination.
Current usage metrics show cumulative count of Article Views (full-text article views including HTML views, PDF and ePub downloads, according to the available data) and Abstracts Views on Vision4Press platform.
Data correspond to usage on the plateform after 2015. The current usage metrics is available 48-96 hours after online publication and is updated daily on week days.
Initial download of the metrics may take a while.