Fig. 1
Download original image
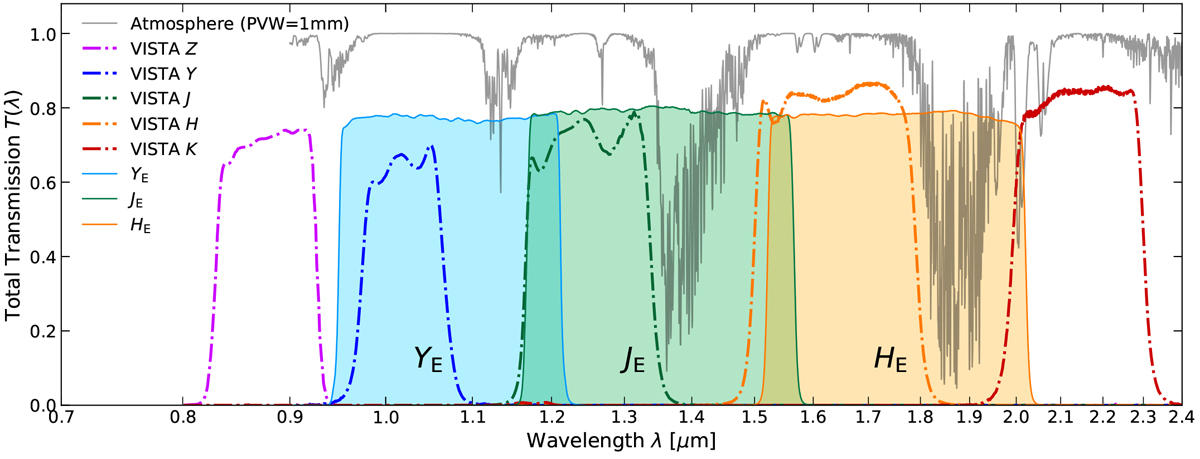
Comparison of the NISP spectral response (shaded) with typical ground-based NIR passbands, in this case VIRCAM at VISTA (Sutherland et al. 2015). Both sets of response curves account for mirrors, filters, and detector QE. The grey line displays the atmospheric transmission for a precipitable water vapour of 1 mm and at zenith, taken from the ESO VISTA instrument description. The ground-based Z and K bands lie outside the NISP wavelength range, whereas Y, J, and H cover approximately half of the corresponding NISP passbands.
Current usage metrics show cumulative count of Article Views (full-text article views including HTML views, PDF and ePub downloads, according to the available data) and Abstracts Views on Vision4Press platform.
Data correspond to usage on the plateform after 2015. The current usage metrics is available 48-96 hours after online publication and is updated daily on week days.
Initial download of the metrics may take a while.