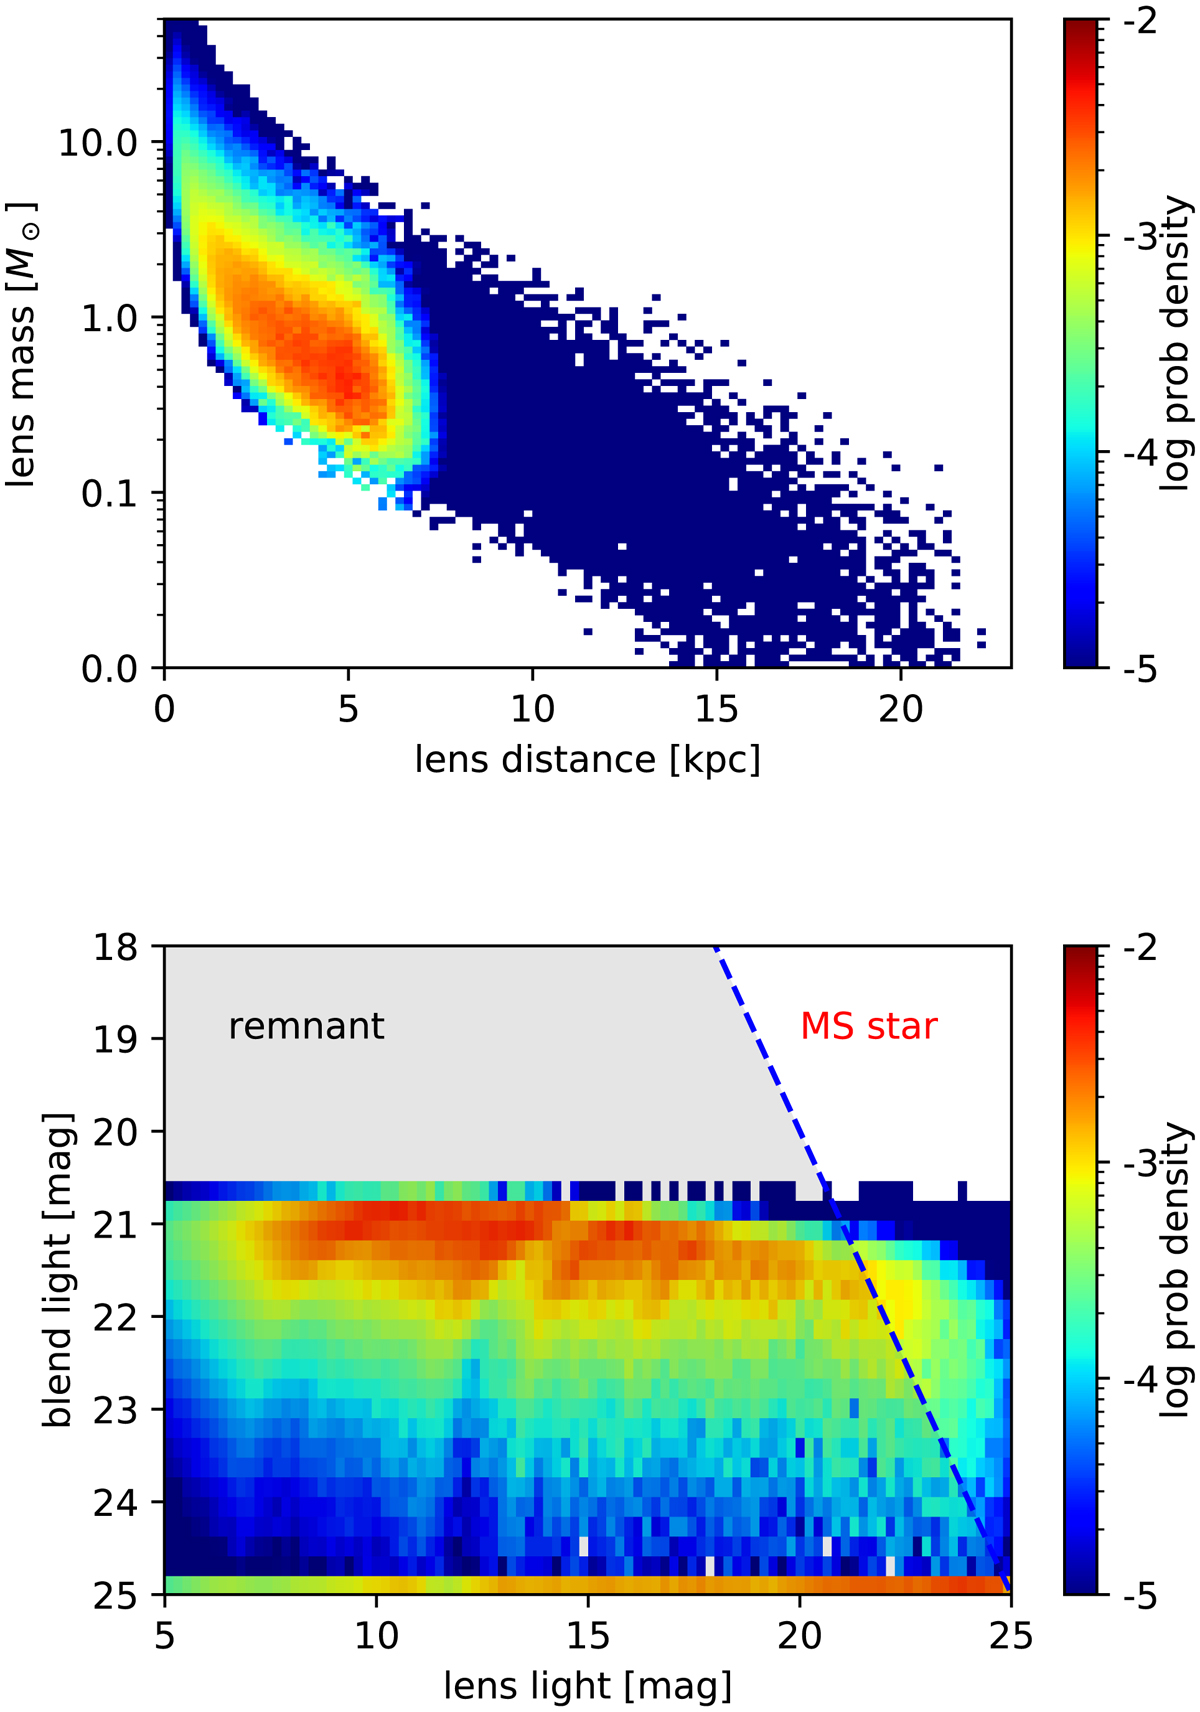
Fig. 5.
Download original image
Posterior distribution of the lens mass, distance, lens light if it was a MS star and allowed blend light obtained using method outlined in Sect. 5. Top: lens mass versus lens distance estimated from MCMC samples for Gaia18cbf for the best fitting model using the Gaia and follow-up data with u0 < 0 and including a microlensing parallax effect, called GF−. Bottom: blended light magnitude from the microlensing model versus the light of the lens expected if the lens was a MS star. The dashed line separates dark lens or remnant solutions from MS star solutions. The colours are the probability density shown on a logarithmic scale.
Current usage metrics show cumulative count of Article Views (full-text article views including HTML views, PDF and ePub downloads, according to the available data) and Abstracts Views on Vision4Press platform.
Data correspond to usage on the plateform after 2015. The current usage metrics is available 48-96 hours after online publication and is updated daily on week days.
Initial download of the metrics may take a while.