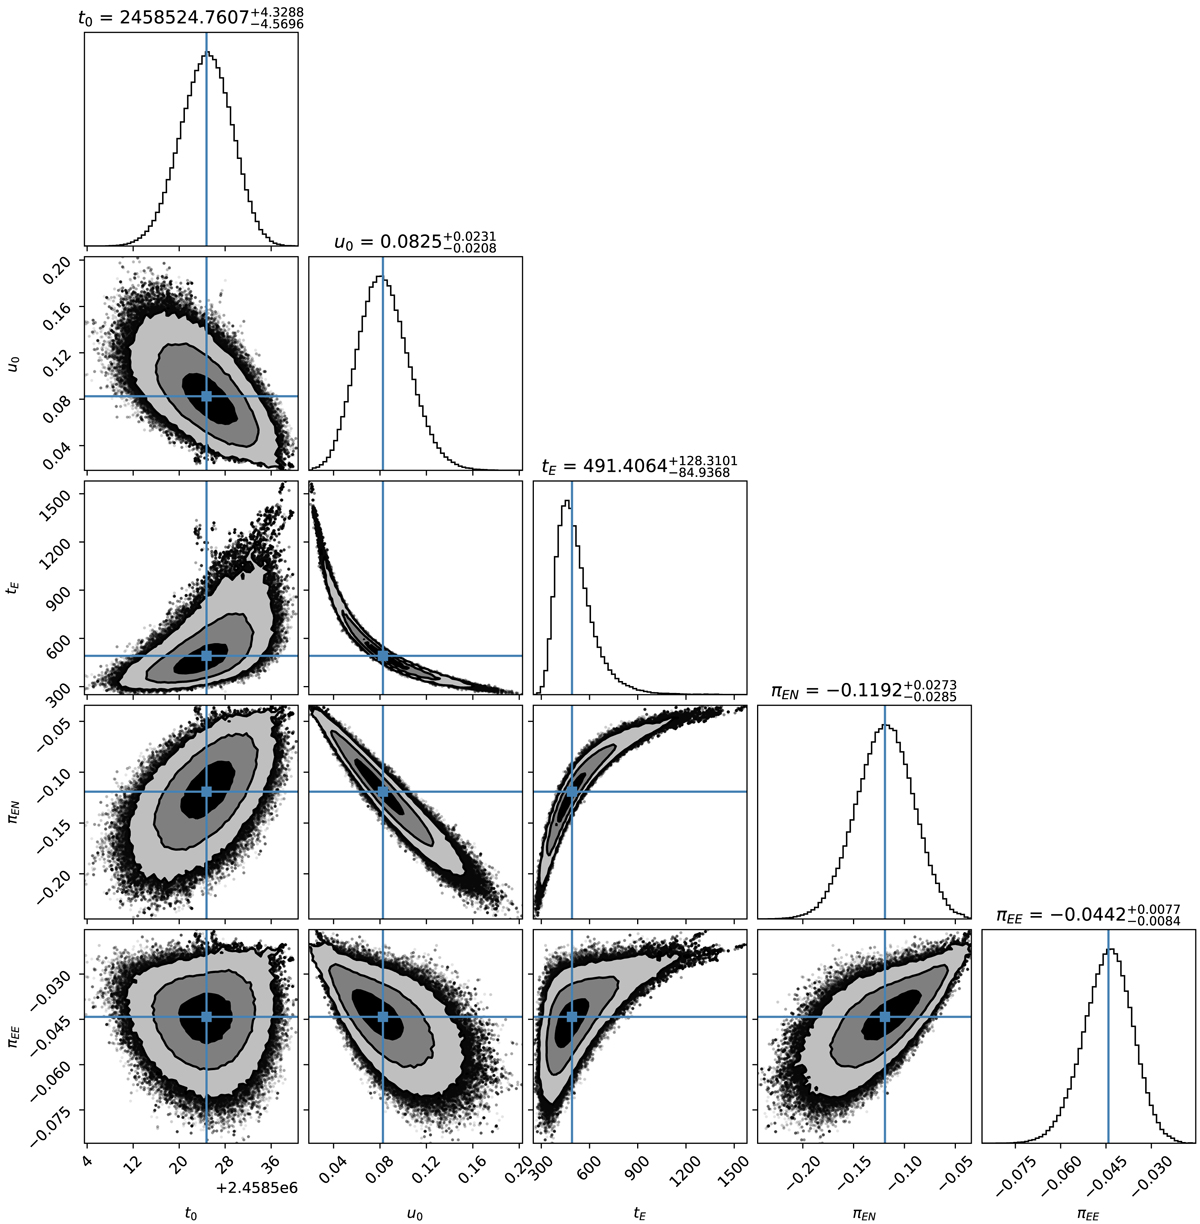
Fig. 3.

Download original image
Chi-squared contours plotted as a function of the parameters fitted in the MCMC fit for the best model, GF+. Black, dark grey, and light grey solid colours represent 1σ, 2σ, and 3σ confidence regions, respectively. Black dots represent solutions outside of the 3/sigma confidence level. Blue lines and squares mark the median solution reported in Table 4. Plot was created using corner python package by Foreman-Mackey (2016).
Current usage metrics show cumulative count of Article Views (full-text article views including HTML views, PDF and ePub downloads, according to the available data) and Abstracts Views on Vision4Press platform.
Data correspond to usage on the plateform after 2015. The current usage metrics is available 48-96 hours after online publication and is updated daily on week days.
Initial download of the metrics may take a while.


