Fig. 9.
Download original image
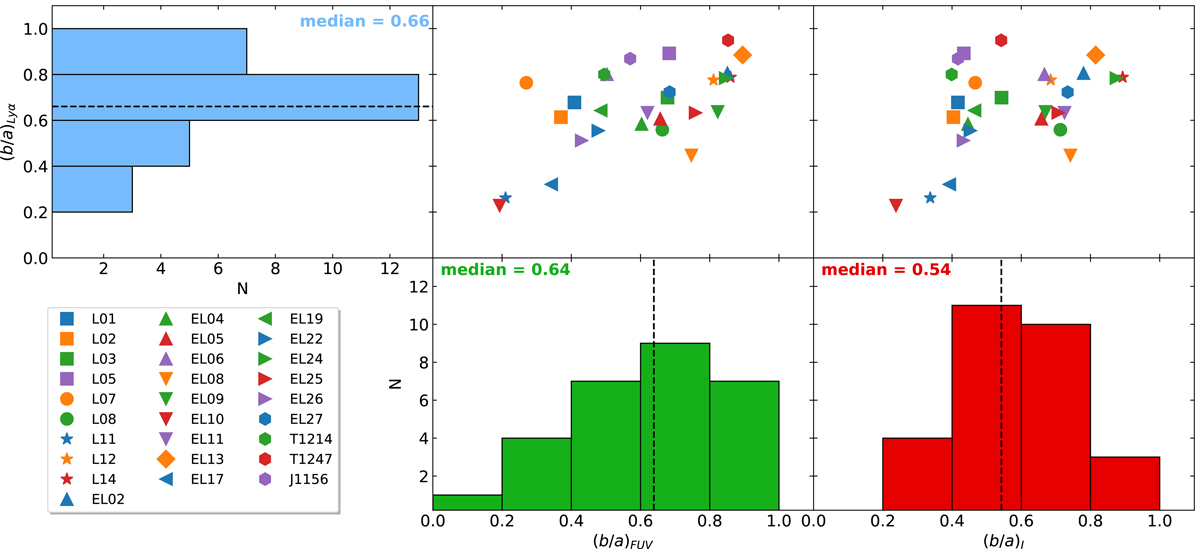
Top left panel: histogram showing the distribution of Lyα axis ratio ((b/a)Lyα). Top middle panel: (b/a)Lyα versus the FUV axis ratio ((b/a)FUV). Top right panel: (b/a)Lyα versus the I band axis ratio ((b/a)I). Bottom middle panel: histogram showing (b/a)FUV distribution. Bottom right panel: histogram showing (b/a)I distribution.
Current usage metrics show cumulative count of Article Views (full-text article views including HTML views, PDF and ePub downloads, according to the available data) and Abstracts Views on Vision4Press platform.
Data correspond to usage on the plateform after 2015. The current usage metrics is available 48-96 hours after online publication and is updated daily on week days.
Initial download of the metrics may take a while.