Fig. 4.
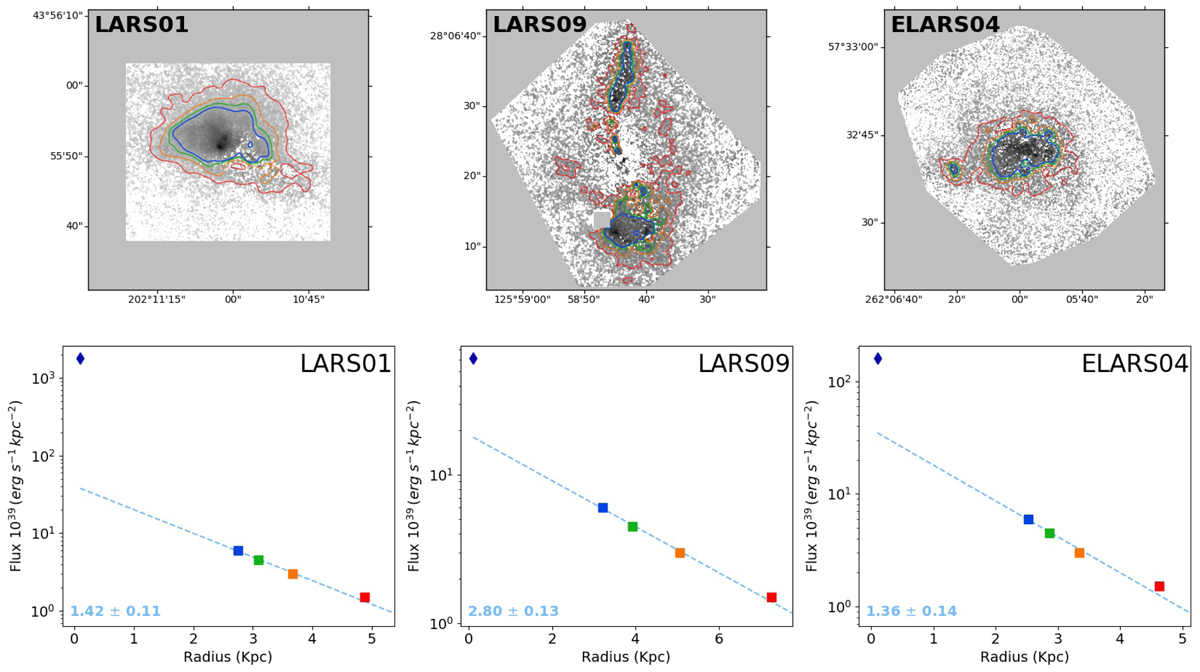
Download original image
Faint Lyα isophotes used to study the extent of the Lyα halo through the isophotal approach for each galaxy. In each figure, in the top panels, the region within the isophotal levels of even multipliers (1, 2, 3, 4) of the faintest limit (1.5 × 1039 erg s−1 kpc−2, except J1156 5.0 × 1039 erg s−1 kpc−2) denoted by red, orange, green and blue contours, all displayed on the Lyα maps of the galaxies. Bottom panels: data points corresponding to these isophotes displayed with the same colour, and a single exponential fit (Eq. (9)) to the points. The fitted scale lengths (and the measured error bar determined from the fit) are given in the lower left corner. The blue diamond represents the measured Lyα SB in the binned images at the innermost region (usually within r = 0.1 kpc from the brightest FUV point).
Current usage metrics show cumulative count of Article Views (full-text article views including HTML views, PDF and ePub downloads, according to the available data) and Abstracts Views on Vision4Press platform.
Data correspond to usage on the plateform after 2015. The current usage metrics is available 48-96 hours after online publication and is updated daily on week days.
Initial download of the metrics may take a while.