Fig. 3.
Download original image
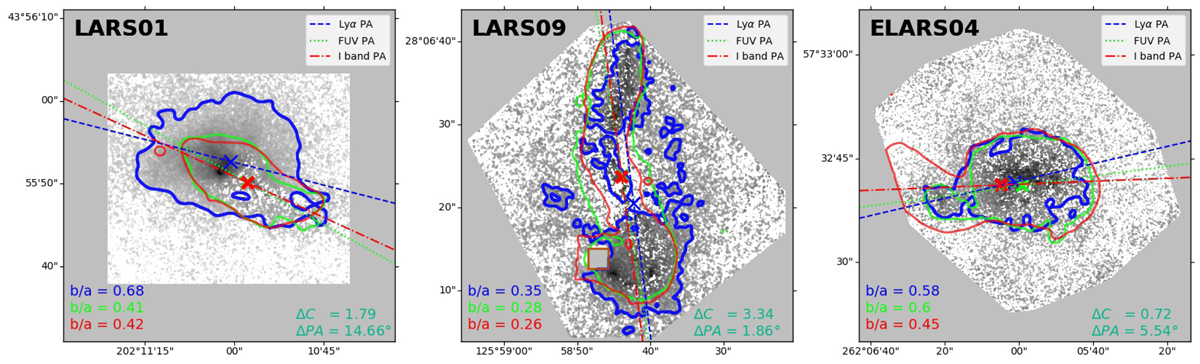
Regions used to determine all the morphological parameters used in this study (ΔC, (b/a)Lyα, (b/a)FUV, (b/a)I, and ΔPA) displayed on the Lyα images for the three galaxies. The blue, green, and red contours are corresponding to the regions where the regions are brighter than SBLyα = 1.5 × 1039 erg s−1 kpc−2, SBFUV = 2.5 × 1037 erg s−1 kpc−2 Å−1, SBI band = 1.5 × 1037 erg s−1 kpc−2 Å−1 all displayed on the Lyα images (for more information on the limits, see Table 2). The blue, green, and red crosses represent the measured centroids (non-weighted first image moment) within LMR for Lyα, within FUV FEI for FUV, and within I band FEI for band, respectively. The determined PAs in the regions are also displayed with blue dashed, green dotted, and red dash-dotted lines for Lyα, FUV, and I band, respectively. Moreover, the axis ratio (b/a)Lyα for each region is printed in the lower left part of the panels with blue, green, and red for Lyα, FUV, and I band, respectively. Finally, the centroid shift (ΔC, in kpc) between Lyα and FUV, and the difference between the measured PA of Lyα, and FUV are printed on the lower right side of the panels.
Current usage metrics show cumulative count of Article Views (full-text article views including HTML views, PDF and ePub downloads, according to the available data) and Abstracts Views on Vision4Press platform.
Data correspond to usage on the plateform after 2015. The current usage metrics is available 48-96 hours after online publication and is updated daily on week days.
Initial download of the metrics may take a while.