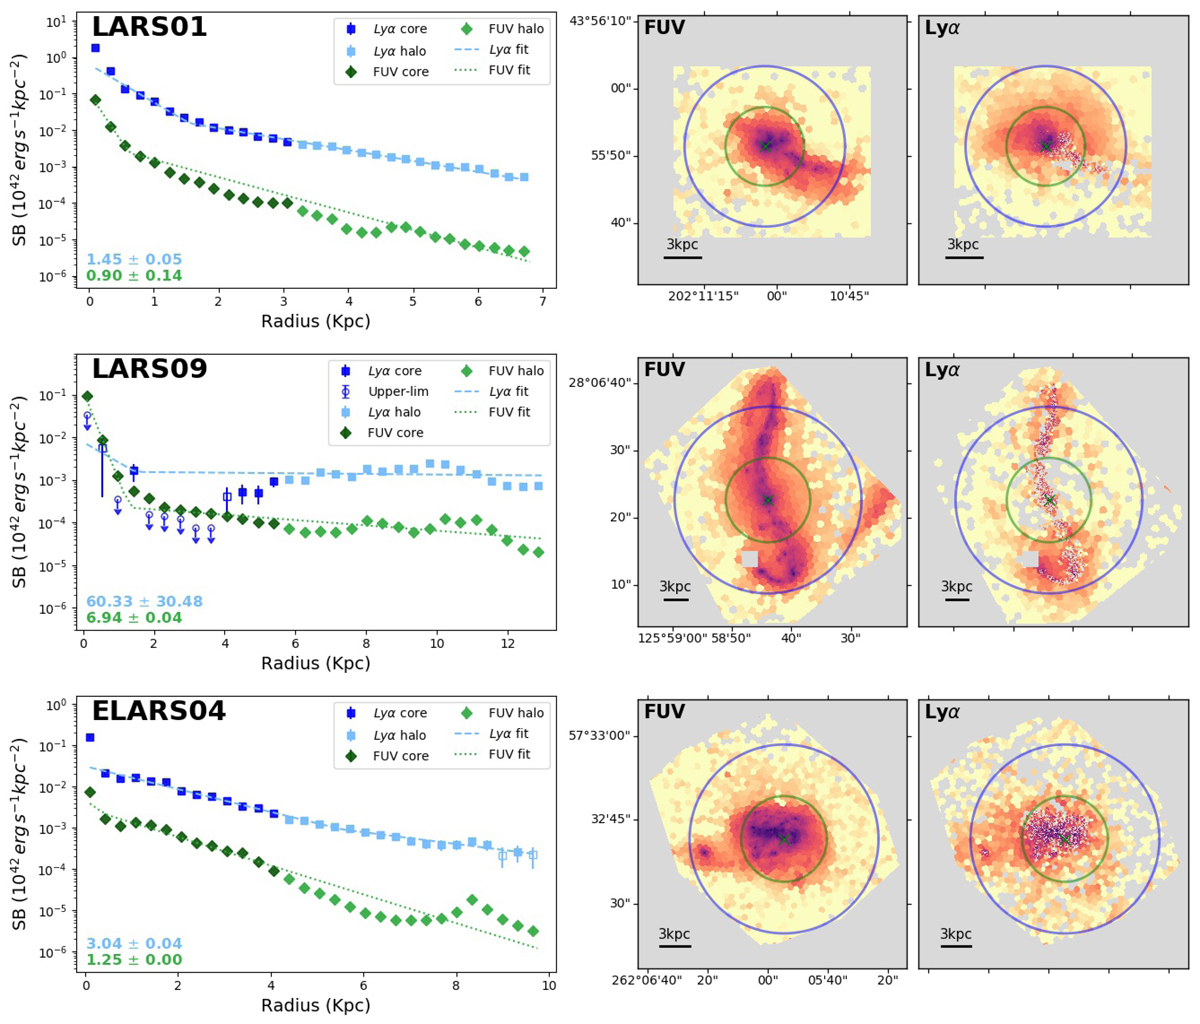
Fig. 2.
Download original image
Lyα, FUV SB profiles, and the fitted double exponential of different galaxies (same galaxies shown in Fig. 1) along with their FUV, and Lyα maps. Left panels: Lyα and FUV profiles and the fitted model to them. The dark and light colours distinguish the core from the halo, respectively. For bins with S/N < 1, the 2σ upper limit are displayed, and the bins with 1 ≤ S/N < 2 (data points not used in the fits) are displayed with the empty square symbol. Middle and right panels: FUV and Lyα maps of each galaxy, respectively. The blue rings represent the largest radii where a circle centred at the FUV brightest pixel fits within each map, used as the last bin where the photometry was performed on. The green ring shows the radius where the SFRD drops below 0.01 M⊙ yr−1 kpc−2.
Current usage metrics show cumulative count of Article Views (full-text article views including HTML views, PDF and ePub downloads, according to the available data) and Abstracts Views on Vision4Press platform.
Data correspond to usage on the plateform after 2015. The current usage metrics is available 48-96 hours after online publication and is updated daily on week days.
Initial download of the metrics may take a while.