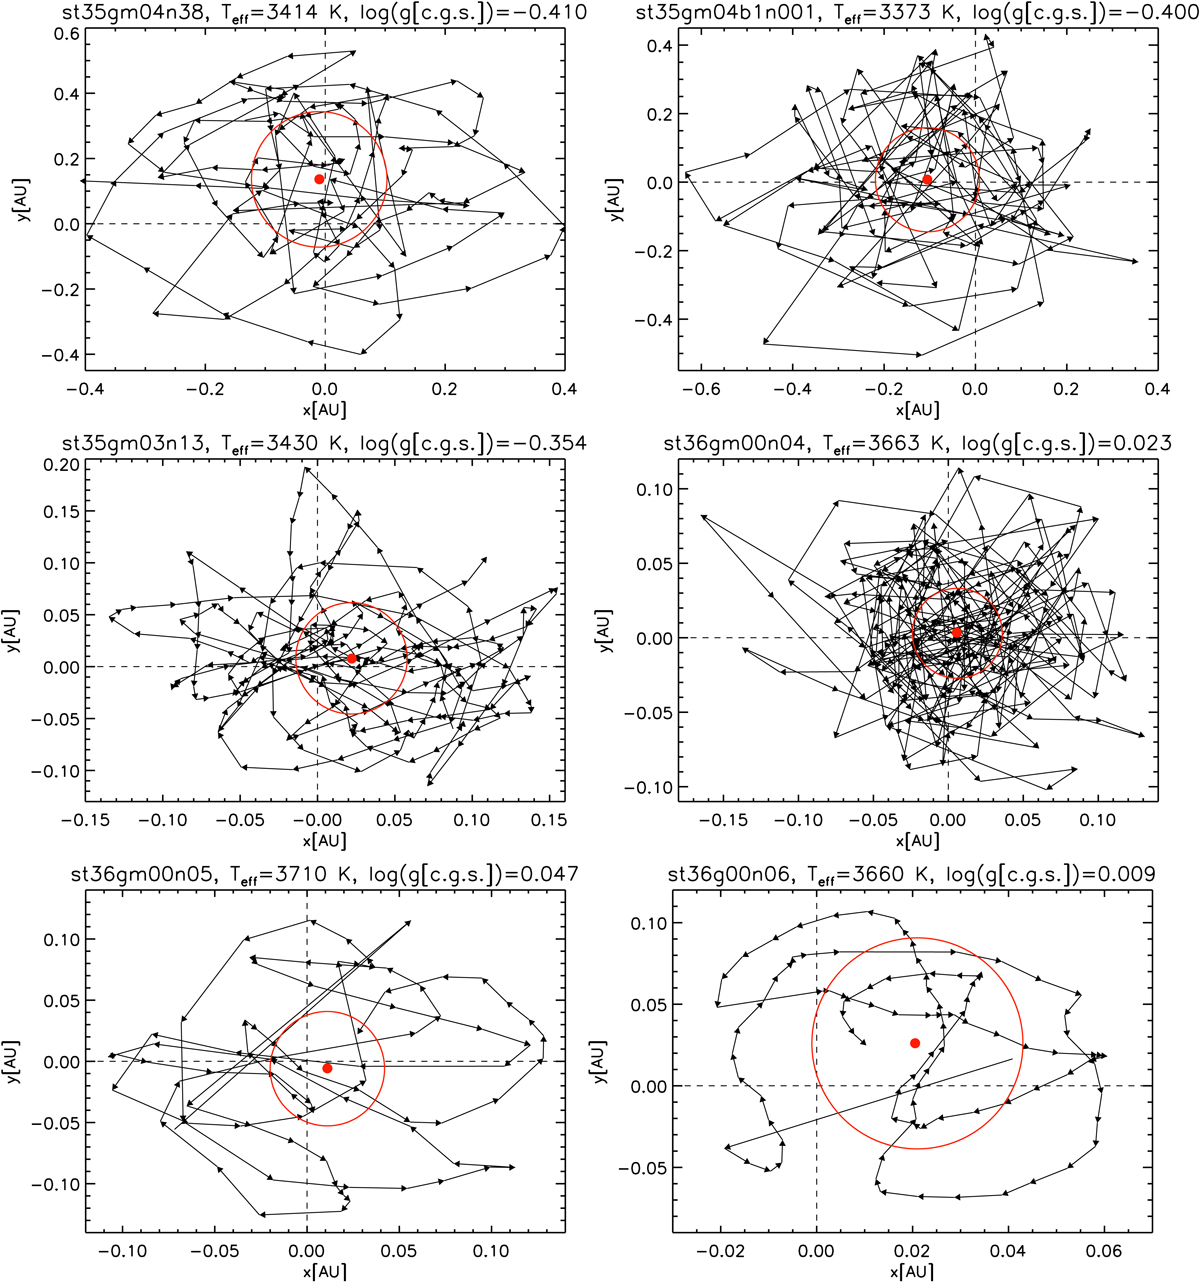
Fig. B.1.

Download original image
Photo-center positions computed from the intensity maps of the RHD simulations in Table 1 in the Gaia G photometric system. The different snapshots are connected by the line segments, the total time covered is reported in the Table. The time interval between two consecutive points is 2 × 10⁶ s (about 23 days) for all simulations except for st35gm04b1n001, for which it is 4 × 10⁶ s. The dashed lines intersect at the position of the geometrical center of the images while the red dot and the red circles display the expected observable position of the star ⟨P⟩ with σP uncertainty. The movies are available online.
Current usage metrics show cumulative count of Article Views (full-text article views including HTML views, PDF and ePub downloads, according to the available data) and Abstracts Views on Vision4Press platform.
Data correspond to usage on the plateform after 2015. The current usage metrics is available 48-96 hours after online publication and is updated daily on week days.
Initial download of the metrics may take a while.


