| Issue |
A&A
Volume 661, May 2022
|
|
|---|---|---|
| Article Number | A69 | |
| Number of page(s) | 10 | |
| Section | Galactic structure, stellar clusters and populations | |
| DOI | https://doi.org/10.1051/0004-6361/202142928 | |
| Published online | 03 May 2022 | |
MUSE spectroscopic observations of the young massive cluster NGC 1850⋆
1
INAF Osservatorio di Astrofisica e Scienza dello Spazio (OAS), Via Gobetti 93/3, 40129 Bologna, Italy
e-mail: This email address is being protected from spambots. You need JavaScript enabled to view it.
2
INAF Osservatorio Astronomico di Padova, Vicolo dell’Osservatorio 5, 35122 Padova, Italy
3
School of Physics & Astronomy, Monash University, Clayton, VIC 3800, Australia
4
INAF Osservatorio Astronomico di Roma, Via Frascati 33, 00078 Monte Porzio Catone, Italy
Received:
16
December
2021
Accepted:
25
February
2022
Abstract
Context. The double cluster NGC 1850 in the Large Magellanic Cloud is the nearest young massive cluster of the Local Group with a mass similar to those of Galactic globular clusters. Recent studies have revealed an extended morphology of its main-sequence turn-off (MSTO), which can be interpreted as a spread in either age or internal rotation. In spite of its proximity, an accurate spectroscopic determination of its chemical properties is still missing.
Aims. We aim to investigate the general chemistry and the kinematics of this stellar system to test whether possible signs of multiple populations are observable in this cluster.
Methods. We analysed the spectra obtained with MUSE in adaptive optics mode of 1167 stars in both components of this cluster (NGC 1850A and NGC 1850B). Thanks to this data set, we were able to measure accurate global metallicities, Ba abundances, and radial velocities for a sample of 38 red supergiants and a guess of the oxygen abundance in the brightest turn-off stars belonging to NGC 1850A.
Results. We find an average metallicity of ⟨[M/H]⟩ = −0.31 ± 0.01, a mean Ba abundance of ⟨[Ba/Fe]⟩ = +0.40 ± 0.02, and a systemic radial velocity of ⟨vLOS⟩ = 251.1 ± 0.3 km s−1. The dispersion of the radial velocities suggests a dynamical mass of log(M/M⊙) = 4.84 ± 0.1, while no significant systemic rotation is detected. We detect a significant bimodality in O I line strength among the turn-off stars of NGC 1850A with ∼66% of stars with [O/Fe]∼ − 0.16 and the rest with no detectable line. The majority of O-weak stars preferentially populate the red side of the MSTO and show H lines in emission, suggesting that they are Be stars rotating close to their critical velocity. Among normal MSTO stars, red stars have broader line profiles than blue ones, on average, suggesting a correlation between colour and rotational velocity.
Conclusions. The mean metallicity of this cluster lies at the metal-rich side of the metallicity distribution of the Large Magellanic Cloud following its age-metallicity relation. The Ba and O abundances agree with those measured in the bar of this galaxy. The correlation between line broadening and colour suggests that the observed colour spread among turn-off stars can be due to a wide range in rotational velocity covered by these stars.
Key words: methods: observational / techniques: spectroscopic / stars: abundances / galaxies: star clusters: individual: NGC 1850
Based on observations collected at ESO telescopes under the observing programme 0102.D-0268(A).
© ESO 2022
1. Introduction
The stellar system NGC 1850 is a young (tage ∼ 93 Myr; Niederhofer et al. 2015) and massive (M = 5.5 × 10⁴ M⊙; Fischer et al. 1993) cluster located at the edge of the Large Magellanic Cloud (LMC) bar. Together with NGC 604 in M33 and NGC 346 in the Small Magellanic Cloud, it is the most massive stellar system of the Local Group younger than 100 Myr (Portegies Zwart et al. 2010). An interesting peculiarity of this cluster is that it is projected close to a potential small companion (NGC 1850B) with ∼1/20 of the main cluster mass and it is characterized by a significantly younger age (tage ∼ 4.3 Myr; Gilmozzi et al. 1994). In the hypothesis that the two clusters are gravitationally bound (as occurs in many other LMC young clusters; Mucciarelli et al. 2012; Dalessandro et al. 2018), this young component would be subject to a strong dynamical friction and will likely merge with the main body of NGC 1850 (NGC 1850A) in the next ∼40 Myr.
In recent years, new observational evidence has prompted a renewed interest in this cluster. Indeed, deep Hubble Space Telescope (HST) photometric studies have revealed multiplicities and spread in the main-sequence-turn off (MSTO) region of the colour-magnitude diagram (CMD) of a few young (< 1 Gyr) and intermediate-age (1−2 Gyrs) Magellanic Cloud clusters (Mackey et al. 2008; Milone et al. 2009). Among them, an extended morphology of the MSTO has been found in NGC 1850A, with a spread that is not compatible with the typical photometric uncertainties (Bastian et al. 2016). When observed through ultraviolet passbands, a split in the main sequence (MS) of this cluster is also apparent (Correnti et al. 2017).
Two main interpretations have been proposed to explain the above evidence. The first interpretation is an age spread of ∼30 Myr (Mackey et al. 2008; Correnti et al. 2017), which is similar to that predicted in Galactic globular clusters (D’Ercole et al. 2008; Piotto et al. 2015), and the second one is a spread in the rotational velocity of intermediate-mass (4 ÷ 5 M⊙) MSTO stars (Bastian & de Mink 2009).
In the hypothesis of a dynamical association between NGC 1850 A and B, all the above evidence implies that in the next 10 Gyr this double cluster might evolve into a system with a mass similar to those of present-day globular clusters (4 < log(M/M⊙) < 6; Baumgardt & Hilker 2018) and that it will end up hosting at least two stellar populations. It could therefore represent a unique connecting ring between globular clusters (where multiple populations are observed several billions of years after the end of their formation) and young massive clusters (YMCs, where the formation of multiple populations might be still ongoing).
In spite of its importance, direct spectroscopic analyses of individual stars in NGC 1850 are extremely rare. In particular, Fischer et al. (1993) analysed echelle spectra of 36 supergiants measuring only their radial velocities. Similarly, Kamann et al. (2021) derived multi-epoch radial velocities for more than 1000 stars in this cluster to investigate binarity and internal rotation among its members. Until recent years, all the metallicity estimates of NGC 1850 had been based on integrated spectroscopy (Usher et al. 2019) or photometric indices (Piatti et al. 2019). Song et al. (2021) determined metallicities for ∼100 member stars using medium resolution spectra, but they did not analyse the abundance of any specific element. This observational gap is due to the distance (d = 50 kpc; Niederhofer et al. 2015) and intrinsic density of NGC 1850, which require an extremely high angular resolution to obtain uncontaminated spectra of individual stars.
In this paper, we analyse more than 1000 individual stars in NGC 1850 observed with the Multi Unit Spectroscopic Explorer (MUSE) integral field spectrograph in adaptive optics mode. This data set allowed us to measure the metal content, the Ba abundance, and the radial velocities of a sub-sample of red supergiants (RSGs) with an excellent accuracy; it also enabled us to investigate the oxygen abundance and the rotational properties of the brightest MSTO stars. The metallicity, the O, and the Ba abundances are indeed easily measurable even in low-resolution spectra and they are crucial in understanding the chemical evolution of the gas from which the cluster formed. These elements are released in the interstellar medium on different timescales by different polluters: supernovae Ia (SNeIa) and II (SNeII), or asymptotic giant branch (AGB) stars. So, the relative abundance of these elements provides an indication of the star formation rate and of the role of the various polluters in the chemical enrichment history of the LMC.
2. Observations and data reduction
Observations consist of a set of spectral cubes observed with the integral field spectrograph, MUSE (Bacon et al. 2010), at the Very Large Telescope of the European Southern Observatory (Cerro Paranal, Chile) under the observing programme 0102.D-0268(A) (PI: Bastian). This data set has recently been used to investigate the relation between binarity and rotation in this cluster (Kamann et al. 2021). The instrument was set up in wide-field mode using the ground-layer adaptive optics system. In this configuration, the instrument’s field of view is 1′×1′ in a grid of 288 × 288 spaxels with a pixel size of 0.2″. In each spaxel, medium-resolution grating disperses the light producing a spectrum with a wavelength range between 4700 Å and 9350 Å. The portion of the spectrum around the sodium doublet between 5805 Å and 5965 Å has been masked to avoid the strong emission of the laser guide star. The spectral resolution varies as a function of wavelength, ranging from R ∼ 1750 at 4700 Å to R ∼ 3750 at 9300 Å. Observations were performed for six nights between January 14 and March 14, 2019, with an average seeing of 1.3″. During each night, 2 × 400 s exposures were acquired in a field centred on NGC 1850A, and 3 × 500 s exposures on a partially overlapping field located ∼1′ away from the cluster centre. Data cubes were processed and combined using the 2.4 version of the MUSE pipeline (Weilbacher et al. 2020), yielding a single data cube for each observing block. At the end of the reduction process, we obtained six data cubes containing a flux- and wavelength-calibrated spectrum in each spaxel.
Spectra were extracted using specifically developed software. As a first step, the images relative to all wavelengths were stacked together to obtain a high signal-to-noise (S/N) image. Individual sources were detected in this image as isolated peaks with an intensity above 3σ the background noise and no brighter neighbour within 3.4 pixels (∼1 FWHM). The sources’ centres were refined as the intensity-weighted x and y positions within 1 FWHM. A total of 1167 sources have been identified across the entire field of view. Six bright and isolated sources were selected and fitted in each wavelength image with Moffat functions with β = 2.5 and variable σ. The average σ of these six sources as a function of wavelength was interpolated using a low-order polynomial, providing a smooth relation between λ and σ. The corresponding full width at half maximum (FWHM) ranges from 4.2 (at 4700 Å) to 2.8 pixels (at 9300 Å). In the images at each wavelength, the intensity of the detected sources were then derived by simultaneously fitting all pixels within 1 FWHM from any source with Moffat functions with the appropriate value of σ using an iterative point spread function (PSF)-fitting routine. For each source, an average background, calculated as the 3σ-clipped mean of pixels contained in an annulus between 4 and 8 FWHM from the considered source and more distant than 1 FWHM from any other source, was subtracted during the fit. In the wavelength ranges encompassing hydrogen lines, this task was complicated by the presence of the intense and spatially variable emission from diffuse gas. However, the spatial variation of this emission has a typical scale larger than the PSF FWHM, so that an effective background subtraction is also guaranteed for stars embedded in gas clouds.
To identify the various targets on a CMD, archive HST images of NGC 1850 were also retrieved and analysed. They were observed with the Wide Field Planetary Camera 2 (WFPC2) on March 4, 1994 through the F170W, F439W, and F569W filters (prop. ID:5559; PI: Gilmozzi). This data set has been already presented in Gilmozzi et al. (1994). PSF-fitting photometry was performed using DOLPHOT software (Dolphin 2000). The WFPC2 pointing has an almost complete overlap with the MUSE field of view, thus providing accurate magnitudes for 1131 (∼97%) of the MUSE targets.
The targets cover a wide range of magnitude (13 < F539W < 23) and colour (−1 < F439W − F569W < 2), sampling the population of RSG, blue loop, MS of NGC 1850A, the blue supergiants of NGC 1850B, and red giants of the LMC (see Fig. 1). The S/N of the spectra ranges from 3 (at F539W ∼ 22) to 150 (at F539W ∼ 14). Examples of the extracted spectra of a few stars are shown in Fig. 2.
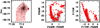 |
Fig. 1. Spatial distribution and photometric properties of target stars. Left panel: map of the analysed MUSE field. Sources with extracted spectra are marked by red dots. Middle and right panels: (F439W–F569W, F569W) (middle) and (F170W–F569W, F170W) CMDs of NGC 1850 (grey points). Target stars are marked by red dots. |
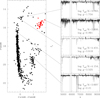 |
Fig. 2. Example spectra of a few stars in our sample. Right panel: from top to bottom, example spectra of a blue loop star, a RSG, a blue supergiant, a MS, and a red giant. Left panel: (F439W–F569W, F569W) CMD of NGC 1850. The positions of the corresponding stars are indicated. The RSG stars of NGC 1850A selected for the kinematic (Sect. 3.1) and chemical (Sect. 3.2) analysis are marked by red dots. |
3. Data analysis
The spectra of target stars were used to measure their radial velocities and abundances. For these purposes, estimates of their effective temperatures and gravities are needed.
These quantities were calculated through the comparison with suitable theoretical isochrones. We adopted the set of solar-scaled isochrones of Marigo et al. (2008), with a metallicity of Z = 0.008 and ages of 15 Myr, 90 Myr, and 10 Gyr for NGC 1850B, NGC 1850A, and the LMC, respectively. Isochrones in the WFPC2 absolute Vegamag photometric system were transformed into apparent ones using the distance modulus (m − M)0 = 18.50 (Niederhofer et al. 2015) and reddening E(B − V) = 0.13 (Górski et al. 2020). A reference isochrone has been associated with each star, according to its position in the CMDs: (i) stars within 5″ from the centre of NGC 1850B or F170W − F569W < −2 have been associated with the youngest 15 Myr isochrone, (ii) stars with F439W − F569W > 0.3 and F569W > 17 have been assigned to the oldest 10 Gyr isochrone, and (iii) the remaining stars have been associated with the 90 Myr isochrone (see Fig. 3). The above criteria unambiguously separate stars belonging to NGC 1850A, NGC 1850B, and the LMC at bright magnitudes (F569W < 18, including all the stars employed in the chemical and kinematic analysis). A certain degree of misassociation is possible at faint magnitudes and blue colours (F569W > 18, F569W − F439W < 0.2). However, in this range all isochrones predict very similar colour-temperature and magnitude-gravity relations, so that this effect is not expected to significantly affect the derived stellar parameters1. A distance in the various CMDs between each star and the associated isochrone was calculated adopting the metric between colours and magnitudes (Δ(F170W − F439W),Δ(F170W − F569W),Δ(F439W − F569W),ΔF170W, ΔF439W, ΔF569W) = (0.84, 0.88, 0.66, 1.4, 1.19, 1.22)2. The temperature and gravity corresponding to the point of the isochrone at the minimum distance have been assigned to the star.
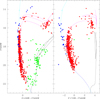 |
Fig. 3. (F439W − F569W, F569W) (left) and (F170W − F569W, F170W) (right) CMDs of NGC 1850. Target stars associated with NGC 1850A, NGC 1850B, and the LMC are marked by red, blue, and green dots, respectively. The Marigo et al. (2008) isochrones with ages of 15 Myr, 90 Myr, and 10 Gyr are plotted in both panels with cyan, magenta, and black solid lines, respectively. We adopted the distance modulus (m − M)0 = 18.50 (Niederhofer et al. 2015) and the reddening E(B − V) = 0.13 (Górski et al. 2020). |
The technique described above requires at least two available magnitudes. Unfortunately, some (346) faint targets have one or no WFPC2 magnitudes.
To overcome this problem, a pseudo colour and magnitude were calculated for all targets from their spectra as
Linear relations linking the various WFPC2 colours and magnitudes with col and mag were calculated. They were adopted to derive the missing magnitudes and colours of the faint targets needed to apply the above procedure.
3.1. Kinematics
The radial velocities of target stars were derived by cross-correlating stellar spectra with appropriate synthetic spectra from the Bt-Settl model grid (Allard 2014). For each target star, a synthetic spectrum with the same temperature and gravity and [M/H] = −0.5 was interpolated through the grid and adopted as a template. Cross-correlation was performed using the fxcorr task within the IRAF3 package (Tody 1986). Radial velocities of different epochs were individually derived and averaged. The error on the mean provides an estimate of the associated uncertainty. Accuracies vary greatly across the CMD: cold (F439W − F569W > 0.8, corresponding to temperatures T < 5000 K) stars have errors σv < 0.5 km s−1 down to F569W < 18 and increasing to σv ∼ 2 km s−1 at F569W = 20, while errors as large as σv ∼ 5 km s−1 can be found among blue (F170W − F569W < −1.5; T > 20 000 K) stars even at bright magnitudes (F569W < 18). At fainter magnitudes (F569W > 20), the S/N drops, leading to errors σv > 10 km s−1 regardless of colour. Given the significant contamination from field LMC stars and the significantly large error in the radial velocities of MS stars, we limited the kinematic analysis to a sub-sample of 38 RSGs. They were selected on the (F439W − F569W, F569W) CMD as those stars with F439W − F569W > 1 and 15 < F569W < 16.2, and they are characterized by an extremely accurate radial velocity (0.1 < σv/km s−1 < 0.6). None of these stars exhibit a significant radial velocity variation among the six epochs. This means that either they are single stars or that their companion is a low-mass star that does not significantly affect the radial systemic velocity. A star-to-star comparison with the nine RSGs in common with the sample analysed by Song et al. (2021) indicates a difference of ΔvLOS,this work−S21 = 0.06 ± 0.30 km s−1 (rms = 0.91 km s−1) and ΔvLOS,this work−S21 = 0.17 ± 1.04 km s−1 (rms = 3.11 km s−1) including six further blue stars in common, indicating no systematics between the two determinations. The error-weighted average velocity of these stars is ⟨vLOS⟩ = 251.1 ± 0.3 km s−1. This measure is in agreement with that provided by Fischer et al. (1993) (⟨vLOS, F93⟩ = 251.4 ± 2.0 km ss−1), while it is slightly higher than that found by Song et al. (2021) ( ).
).
The distribution of radial velocities as a function of the position angle was also used to test the possible presence of systemic rotation (see Fig. 4). Indeed, in the presence of a significant rotation with an axis inclination angle i ≠ 0, a sinusoidal modulation should be observable. The best fit with a sine function provides a rotation amplitude of A = 0.5 ± 0.5 km s−1. To test the significance of such a signal, the analysis was repeated 104 times by randomly swapping the position angles of stars. Amplitudes as large as the observed one were obtained in ∼52% of the extractions, indicating that the detected rotation signal is not significant. This evidence conflicts with the significant rotation signal claimed by Fischer et al. (1993) (A = 2.1 km s−1 with a 93% confidence level).
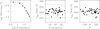 |
Fig. 4. Kinematic fit of NGC 1850A. Left panel: projected density distribution of NGC 1850A. The best fit King (1966) model is overplotted. Middle panel: distribution of radial velocities of RSG stars as a function of the distance from the cluster centre. The 3σ boundary predicted by the best fit King (1966) model is overplotted. Right panel: distribution of radial velocities of the same sample as a function of the position angle. The best fit sinusoidal curve is overplotted. |
The dynamical mass of NGC 1850A was estimated by fitting the velocity dispersion profile of RSGs with the prediction of an isotropic King (1966) model. For this purpose, the projected density profile of NGC 1850A was derived by selecting from the entire WFPC2 photometric catalogue MS and RSG stars brighter than F569W < 20 on the (F439W − F569W, F569W) CMD, and calculating the local number density in concentric annuli around the cluster centre. The density profile was then fitted with a King (1966) model with central adimensional potential W0 = 5 and core radius  (corresponding to a half-mass radius of rh = 12.88 pc at a distance of 50 kpc; see Fig. 4). The dynamical mass was then estimated by normalizing the corresponding velocity dispersion profile to the distribution of observed radial velocities, using a maximum-likelihood algorithm (see e.g. Pryor & Meylan 1993). We derived a dynamical mass of log(M/M⊙) = 4.84 ± 0.10, in good agreement with that found by Fischer et al. (1993) (log(M/M⊙)F93 = 4.76 ± 0.18) and Song et al. (2021) (
 ). A similar estimate has been found from photometric studies by Correnti et al. (2017) and McLaughlin & van der Marel (2005) (log(M/M⊙) = 4.86 ± 0.10 in both studies).
3.2. Global metallicity
The spectra of RSGs in NGC 1850A contain a plethora of metal lines across the entire spectrum. Moreover, stellar winds originating from the envelope expansion carry out any eventual angular momentum, thus preventing any rotation-induced chemical anomalies. They are therefore well suited to estimate the global metallicity of this cluster. For this purpose, we adopted a full spectrum fit with synthetic templates. For each star, the spectra of the six exposures were corrected for Doppler shift and averaged. The spectral range (7000 Å − 9000 Å) was used in the fit, masking the emission lines, when present.
We adopted the grid of synthetic spectra of Bt-Settl (Allard 2014). This library adopts the solar metallicity of Asplund et al. (2009) and a metallicity-dependent α-enhancement ([α/Fe] = +0.4 for [M/H] ≤ −1, [α/Fe] = +0.2 for −1 < [M/H] ≤ −0.5, and [α/Fe] = 0 for [M/H] > −0.5). Synthetic spectra were degradated at the MUSE resolution and fluxes were corrected for dust extinction using the attenuation curve of Cardelli et al. (1989), adopting a reddening E(B − V) = 0.13 (Górski et al. 2020).
In the fit, we kept the gravity to the photometric estimate fixed and searched the minimum χ2 in the Teff − [M/H] plane. The search was carried out using a Powell’s conjugate direction algorithm (Brent 1973), starting from the photometric temperature and a metallicity [M/H] = −0.5 as first guesses. So, the best fit was obtained with the parameters simultaneously providing a good fit of both the global shape of the continuum and the line depths. An example of the 2D fit is shown in Fig. 5.
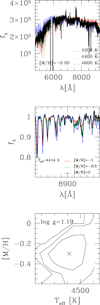 |
Fig. 5. Example of 2D fit in the Teff − [M/H] plane for a sample RSG star. The probability map is shown in the bottom panel. The location of the peak and the 1, 2, and 3σ contours are shown. The spectrum fit along two projections are shown for different temperatures (top panel) and metallicities (middle panel; in this panel only a small portion of the spectrum is shown for better readability). |
Uncertainties were estimated from the χ2-associated probability as a function of [M/H], after marginalizing the dependence on temperature. The estimated errors on [M/H] were found in the range 0.06 < σ[M/H] < 0.12 dex. The weighted average of the metallicity turns out to be ⟨[M/H]⟩= − 0.31 ± 0.01. The rms of the sample measures is 0.09 dex, similar to the typical individual uncertainties, thus indicating no significant intrinsic spread in metallicity. The only spectroscopic estimate based on individual spectra is the one by Song et al. (2021) who found [Fe/H]= − 0.31 ± 0.20, which is in excellent agreement with the value found here. A star-to-star comparison among the nine stars in common indicates [M/H]this work − [Fe/H]S21 = −0.15 ± 0.09 (rms = 0.27), which indicates a fair consistency between these two works. Other measures available in the literature for this cluster come from integrated spectra of the CaII triplet region ([Ca/H]= − 0.52 ± 0.07; Usher et al. 2019) and from Stromgren photometric indices ([Fe/H]= − 0.53 ± 0.04; Piatti et al. 2019), which are both in reasonable agreement with the value estimated here, considering the systematics possibly affecting estimates obtained with very different tracers and techniques.
The celestial coordinates, WFPC2 magnitudes, gravities, temperatures, radial velocities, and metallicities of the 38 targets RSGs of NGC 1850A analysed here are listed in Table 1.
Radial velocities, metallicities, and Ba abundances of the 38 target RSGs of NGC 1850A.
3.3. Ba abundance
The abundance of Ba is the easiest to measure among elements with a dominant s-process contribution because of its strong and isolated lines, which are also easily measurable at relatively low resolution. Barium is mainly produced through the slow-neutron capture chain occurring in the envelopes of low- and intermediate-mass AGB stars. Its abundance is therefore useful to determine the contribution of low-mass stars to the chemical enrichment of the original medium from which the cluster formed.
Barium abundances were derived through spectral synthesis calculations of the strong Ba II line at 6141.7 Å using the driver synth in the local thermodynamical equilibrium (LTE) code MOOG (Sneden 1973, 2019 version). The line list includes isotopic splitting and a hyperfine structure, following the prescriptions by McWilliam (1998). We adopted a solar-scaled isotopic mixture of 134Ba = 2.4%, 135Ba = 6.6%, 136Ba = 7.9%, 137Ba = 11.2%, and 138Ba = 71.9%. The line under scrutiny in the present study is known to be blended with a Fe I line, which we took into account in our spectral synthesis. A metallicity of [M/H] = −0.3 was assumed for all of our sample stars (see Sect. 3.2). Effective temperature and surface gravity were calculated as described in Sect. 3.2, whereas we used the relationship by Kirby et al. (2009) to calculate the microturbulent velocities.
For each target, a synthetic spectrum degraded to match the resolution of the observed one was simulated and the corresponding χ2 was computed. The Ba abundance providing the minimum χ2 was chosen. Random errors affecting our best-fitting procedure were evaluated by changing the continuum position until the rms of the fit around the Ba line was 2.5 times larger than that obtained with the best fit abundance. This implies uncertainties between 0.08–0.10 dex. On the other hand, the sensitivities related to the adopted stellar parameters were evaluated by varying one parameter at the time and inspecting the corresponding change in abundances (D’Orazi et al. 2020, and references therein). By propagating the uncertainties on these parameters through these sensitivities, an additional scatter of 0.10 dex was added.
The average Ba abundance derived from the 38 RSG stars turns out to be ⟨[Ba/Fe]⟩ = 0.40 ± 0.02. The rms of the measures is 0.08 dex, compatible with the typical uncertainty in the Ba abundance determination, thus implying no intrinsic spread among the analysed stars. The Ba abundances of the 38 targets RSGs analysed here are listed in Table 1.
3.4. Oxygen abundance
At odds with RSGs, MS and blue supergiants have temperatures T > 8000 K and contain essentially H and He lines. However, in the brightest portion of the MS, the S/N is high enough to detect the O I triplet lines at 7771−5 Å which appears as a single blended feature at the MUSE resolution. This feature has been proven to be extremely useful to determine the O abundance in B-F type stars (Takeda et al. 2008; Takeda & Honda 2016).
The abundance of oxygen is particularly important for many aspects of stellar physics, cluster formation, and chemical enrichment. Indeed, while metals are produced in both SNe Ia and II, O is mainly released by SNeII and processed through the CNO cycle at a high temperature in massive stars. The relative fraction of oxygen over iron is therefore large at the beginning of the star formation process and it decreases after the explosion of the first SNe Ia. So, the [O/Fe] abundance at a given metallicity can be used as a proxy for the velocity of the chemical enrichment. Moreover, the presence of an O spread has been the main marker of multiple populations in Galactic globular clusters (Carretta et al. 2009). In rotating massive stars, O spreads can however also be produced by the mixing induced in the outermost layers by meridional circulation. In these stars, O-depleted material could be dredged up together with other CNO-processed material (Georgy et al. 2013).
We measured the equivalent width (EW) of the O I triplet by numerically integrating the average continuum-normalized spectrum in the wavelength region between 7765 Å and 7785 Å bracketing this feature. The continuum was set by linearly interpolating the fluxes through two 20 Å-wide regions on both sides of the O I triplet. We restricted the analysis of O abundances to those stars along the MS, selecting stars in the gravity range 3.5 < log g < 4.5. As for any other index, the accuracy in the measure of the O I EW is better at bright magnitudes.
The trend of O I EWs as a function of temperature is shown in Fig. 6 for the brightest (F569W < 18) stars. As expected, the O I triplet EW shows a clear trend with temperature with a peak at 3.9 < log(Teff/K) < 4.2 and a decreasing trend outside this range, reflecting the probability of a transition for the neutral oxygen. However, in the temperature range 4.1 < log(Teff/K) < 4.2, a striking bimodality is apparent. In particular, while the majority of stars in this temperature interval have an EW ∼ 0.3 Å, a group of stars constituting approximately a third of the sample does not host a measurable line.
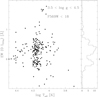 |
Fig. 6. EW of the O I triplet as a function of temperature for bright MS stars. The histograms for stars in the range 4.1 < log(Teff/K) < 4.2 in EW are also shown. |
A guess as to the O abundance from the EW of this line can be determined by interpolating through the non-LTE grid of synthetic EWs for this line calculated by Takeda & Honda (2016) as a function of gravity and temperature. The group of O-strong stars have a mean abundance ⟨[O/H]⟩= − 0.47 ± 0.04 (rms = 0.45 dex), corresponding to ⟨[O/Fe]⟩= − 0.16 ± 0.05.
By applying a conventional separation of the O-strong groups at EW > 0.07 Å, there are 53 (out of 157; 34%) O-weak stars brighter than F569W < 18. By adopting this classification, we analysed the distribution of these groups in the CMD and across the field of view. The location in the (F439W − F569W)-F569W CMD is shown in Fig. 7. It can be noticed that while at faint magnitudes, O-strong and O-weak stars share the same locus on the CMD; furthermore, close to the MSTO, O-weak stars are systematically redder than O-strong ones. A KS test indicates that the probability of the two colour distributions being drawn from the same parent population is only 3%. We also note that the two groups have similar spatial distributions: a KS test indicates a probability larger that 99% of the two samples being extracted from the same population.
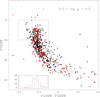 |
Fig. 7. (F439W − F569W)-F569W CMD of NGC 1850 stars with 3.5 < log g < 4.5. O-strong and O-weak stars are marked by black and red symbols, respectively. The colour histograms of both groups in the magnitude range 16 < F569W < 18 are shown in the inset panel. |
A close inspection of individual spectra of O-weak stars reveals that most of them have H lines in emission (see Fig. 8). To quantify this effect, we calculated the EWs of seven H lines. EWs were measured on the average spectra, and assuming a 40 Å wavelength band around the lines’ centres and two contiguous regions of the same width on both sides of the line band to estimate the continuum. We would like to note that Hα in emission (EW(Hα) < 0) was found in 47 out of 53 (89%) O-weak stars, while only in 33 out of 104 (32%) O-strong stars. The total fraction of Hα emitters (∼51%) is similar to those measured by Wisniewski & Bjorkman (2006) and Bastian et al. (2017) in the same magnitude range. In general, the EWs of all the seven H lines show a clear increasing trend with the O I triplet EW (see Fig. 9). This is due to the presence of emission superposed to the canonical line profile which reduces the EW of both H and O I lines (Polidan & Peters 1976). In most cases the emission is often limited to the line core, so that the measured EW, while reduced, remains positive.
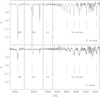 |
Fig. 8. Comparison between the spectra of two O-strong (top panel) and O-weak (bottom panel) MS stars. The H lines as well as the O I triplet are indicated. |
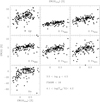 |
Fig. 9. EWs of hydrogen lines as a function of the O I triplet EW for the bright MS stars of NGC 1850. |
3.5. Rotational velocities
As outlined in Sect. 1, one of the hypotheses to explain the observed spread in the MSTO of NGC 1850 is that it is due to a spread in rotational velocities. Stellar rotation can be measured in high-resolution spectra through the broadening of isolated spectral lines, measured through the Fourier analysis (see e.g. Díaz et al. 2011). Unfortunately, the relatively low spectral resolution and S/N of our spectra do not allow for this technique to be adopted (see Kamann et al. 2020, for an alternative approach).
It is however possible to determine the average line profile of a few isolated lines in the average spectrum of groups of stars selected in colour. For this purpose, the spectra of MSTO stars in the ranges 3.5 < log g < 4.5, F569W < 18 and EW(Hα) > 0 Å (to exclude Be stars, characterized by strongly asymmetric lines) have been grouped in two samples according to their colours. Individual spectra of each group were corrected for relative velocity and averaged to obtain a high S/N average spectrum. The average line profile of a sample of seven relatively isolated lines (He I 4922, He I 5016, He I 5046/8, He II 5411, He I 6678, He I 7065, and O I 7771/5) was derived by cross correlating the average spectrum with Dirac deltas centred at each line wavelength (see Fig. 10).
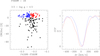 |
Fig. 10. Rotational profiles of blue and red MSTO stars. Left panel: distribution of MSTO stars of NGC 1850A with 3.5 < log g < 4.5 and F569W < 18 in the F439W − F569W vs. EW(Hα) plane. Stars bluer and redder than F439W − F569W = −0.23 are marked by blue and red points, respectively, while Be stars are marked by black points. Right panel: average line profiles of the blue (blue line) and red (red line) samples. |
It is apparent that the average spectrum of red stars is characterized by broader lines (FWHMred ∼ 280 km s−1) than those measured in the average blue one (FWHMblue ∼ 220 km s−1). This suggests a higher rotational velocity for red stars.
4. Discussion
The analysis of MUSE spectra in the YMC NGC 1850 allowed us to derive a sound spectroscopic estimate of the cluster global metallicity on the basis of individual RSG spectra. The derived metallicity (⟨[M/H]⟩= − 0.31 ± 0.01) is more metal rich than the LMC bar ([M/H]= − 0.68, rms = 0.12 dex Van der Swaelmen et al. 2013), but similar to that measured in other young LMC clusters (Hill & Spite 1999). This is in agreement with the age-metallicity gradient found by many authors (Olszewski et al. 1991; Livanou et al. 2013) with young clusters forming from a medium enriched in metals with respect to old stellar populations. On the other hand, Ba abundances agree with the mean abundance measured in the LMC bar ([Ba/Fe]∼ + 0.5 Van der Swaelmen et al. 2013), typical of environments characterized by a slow chemical enrichment dominated by the contribution of low-mass AGB stars (1.5 < M/M⊙ < 4).
The spectra of RSGs were also used to determine the systemic velocity and the dynamical mass of NGC 1850. The derived quantities agree with the only available spectroscopic estimates in the literature (Fischer et al. 1993; Song et al. 2021). At odds with the study of Fischer et al. (1993), we did not find any significant sign of systemic rotation.
We detected a clear bimodality in the EW of the O I triplet at 7771−7775 Å among bright MS stars in NGC 1850A. In particular, the majority of stars display clear absorption while in a group of stars, constituting ∼34% of the bright MS sample; this feature is not apparent. O-weak stars appear slightly redder than O-strong ones, and almost all of them are Hα emitters. The O abundance derived for O-strong stars ([O/Fe] = −0.16 ± 0.05) agrees with the value measured in stars with a similar metallicity in the LMC bar by Van der Swaelmen et al. (2013) (⟨[O/Fe]⟩∼ − 0.2), which is characteristic of relatively low-mass galaxies where the overabundance of α-elements with respect to Fe produced by SNe has been diluted by the contribution by SNe Ia.
The most likely interpretation of the observed bimodality is that the EWs of O lines in MSTO stars reflects the degree of rotation of these stars. Hydrogen line (and often O I triplet line; Polidan & Peters 1976) emission in hot (T > 10 000 K) B stars is indeed often associated with rotation. In fact, rapid rotators (Ω ∼ Ωcrit) in this phase eject a significant amount of material and develop a dense equatorial disk which is excited by stellar ultraviolet photons (Be stars; Rivinius et al. 2013). The absence of the O I triplet line in O-weak stars could then be due to either the superposition of emission and absorption lines (Polidan & Peters 1976) or to a true O depletion in the envelope of these stars driven by rotation-induced mixing (Georgy et al. 2013). The latter hypothesis is however disfavoured by the observational work of Takeda & Honda (2016), who found no dependence of the derived O abundance (calculated using the same indicator we adopted in our analysis) from the rotational velocity in the spectra of 34 B stars with different rotational velocities, and by the theoretical models of rotating stars predicting a depletion of only Δ[O/H] = −0.03 dex for a 4 M⊙ star with Ω/Ωcrit = 0.95 (Georgy et al. 2013). Following the same line of reasoning, Bastian et al. (2017) interpreted the large fraction of Be stars in NGC 1850 as evidence for a large population of rapid rotators. Rotating stars have an equilibrium structure characterized by larger radii, and consequently lower temperatures and redder colours, with respect to non-rotating stars.
The role of rotation in producing the colour spread at the MSTO is supported by the link between line broadening and colour in MSTO stars. Stars on the red side of the MSTO do indeed have broader line profiles, suggesting a higher degree of internal rotation with respect to stars on the blue side (see also Kamann et al. 2021). This could also be the reason why the colour spread remains visible even excluding Be stars (Correnti et al. 2017): these stars are indeed at the extreme of the distribution of rotational velocities (Ω ∼ Ωcrit), while a shift towards red colours can also be present in stars rotating with lower velocities.
An alternative interpretation is that the detected bimodality in O abundance is primordial. In this hypothesis, the origin of the H lines’ emission in the oldest O-poor population is not clear however.
Unfortunately, our spectra do not have enough resolution to detect differences in the stellar rotation of individual stars. Future high-resolution spectroscopic analyses focussed on determining this parameter will be fundamental to clarify the nature of this bimodality.
Since the purpose of the described task is to determine the most appropriate temperature and gravity, the adopted criterion is set to associate each star to the most appropriate isochrone, not necessarily the one corresponding to the host cluster. For instance, the temperature and gravity of a NGC 1850A blue straggler star, rejuvenated through mass transfer in binary, are better reproduced by the young isochrone.
Such a metric was chosen to approximately reproduce the rms of the various colours and magnitudes in the WFPC2 catalogue among stars with all the three available magnitudes.
IRAF is distributed by the National Optical Astronomy Observatories, which is operated by the Association of Universities for Research in Astronomy, Inc. (AURA) under cooperative agreement with the National Science Foundation.
Acknowledgments
We warmly thank Alessio Mucciarelli, Livia Origlia and Cristiano Fanelli for useful suggestions. We also thank Nate Bastian, the referee of our paper, for his helpful comments and suggestions that improved our paper. Part of this work was supported by the Istituto Nazionale di Astrofisica under the PRIN 2019 founding program prop.ID 96 – “Building up the halo: chemo-dynamical tagging in the age of large surveys” (PI: Lucatello).
References
- Allard, F. 2014, in Exploring the Formation and Evolution of Planetary Systems, 299, 271 [Google Scholar]
- Asplund, M., Grevesse, N., Sauval, A. J., & Scott, P. 2009, ARA&A, 47, 481 [NASA ADS] [CrossRef] [Google Scholar]
- Bacon, R., Accardo, M., Adjali, L., et al. 2010, Proc. SPIE, 7735, 773508 [Google Scholar]
- Bastian, N., & de Mink, S. E. 2009, MNRAS, 398, L11 [NASA ADS] [CrossRef] [Google Scholar]
- Bastian, N., Niederhofer, F., Kozhurina-Platais, V., et al. 2016, MNRAS, 460, L20 [NASA ADS] [CrossRef] [Google Scholar]
- Bastian, N., Cabrera-Ziri, I., Niederhofer, F., et al. 2017, MNRAS, 465, 4795 [NASA ADS] [CrossRef] [Google Scholar]
- Baumgardt, H., & Hilker, M. 2018, MNRAS, 478, 1520 [Google Scholar]
- Brent, R. P. 1973, in Algorithms for Minimization Without Derivatives (Englewood Cliffs, N.J.: Prentice-Hall) [Google Scholar]
- Cardelli, J. A., Clayton, G. C., & Mathis, J. S. 1989, ApJ, 345, 245 [Google Scholar]
- Carretta, E., Bragaglia, A., Gratton, R. G., et al. 2009, A&A, 505, 117 [NASA ADS] [CrossRef] [EDP Sciences] [Google Scholar]
- Correnti, M., Goudfrooij, P., Bellini, A., Kalirai, J. S., & Puzia, T. H. 2017, MNRAS, 467, 3628 [NASA ADS] [Google Scholar]
- Dalessandro, E., Zocchi, A., Varri, A. L., et al. 2018, MNRAS, 474, 2277 [NASA ADS] [CrossRef] [Google Scholar]
- D’Ercole, A., Vesperini, E., D’Antona, F., McMillan, S. L. W., & Recchi, S. 2008, MNRAS, 391, 825 [CrossRef] [Google Scholar]
- Díaz, C. G., González, J. F., Levato, H., & Grosso, M. 2011, A&A, 531, A143 [NASA ADS] [CrossRef] [EDP Sciences] [Google Scholar]
- Dolphin, A. E. 2000, PASP, 112, 1383 [Google Scholar]
- D’Orazi, V., Oliva, E., Bragaglia, A., et al. 2020, A&A, 633, A38 [NASA ADS] [CrossRef] [EDP Sciences] [Google Scholar]
- Fischer, P., Welch, D. L., & Mateo, M. 1993, AJ, 105, 938 [NASA ADS] [CrossRef] [Google Scholar]
- Georgy, C., Ekström, S., Granada, A., et al. 2013, A&A, 553, A24 [NASA ADS] [CrossRef] [EDP Sciences] [Google Scholar]
- Gilmozzi, R., Kinney, E. K., Ewald, S. P., Panagia, N., & Romaniello, M. 1994, ApJ, 435, L43 [NASA ADS] [CrossRef] [Google Scholar]
- Górski, M., Zgirski, B., Pietrzyński, G., et al. 2020, ApJ, 889, 179 [Google Scholar]
- Hill, V., & Spite, M. 1999, Ap&SS, 265, 469 [NASA ADS] [CrossRef] [Google Scholar]
- Kamann, S., Bastian, N., Gossage, S., et al. 2020, MNRAS, 492, 2177 [Google Scholar]
- Kamann, S., Bastian, N., Usher, C., Cabrera-Ziri, I., & Saracino, S. 2021, MNRAS, 508, 2302 [NASA ADS] [CrossRef] [Google Scholar]
- King, I. R. 1966, AJ, 71, 64 [Google Scholar]
- Kirby, E. N., Guhathakurta, P., Bolte, M., Sneden, C., & Geha, M. C. 2009, ApJ, 705, 328 [NASA ADS] [CrossRef] [Google Scholar]
- Livanou, E., Dapergolas, A., Kontizas, M., et al. 2013, A&A, 554, A16 [NASA ADS] [CrossRef] [EDP Sciences] [Google Scholar]
- Mackey, A. D., Broby Nielsen, P., Ferguson, A. M. N., & Richardson, J. C. 2008, ApJ, 681, L17 [NASA ADS] [CrossRef] [Google Scholar]
- Marigo, P., Girardi, L., Bressan, A., et al. 2008, A&A, 482, 883 [NASA ADS] [CrossRef] [EDP Sciences] [Google Scholar]
- McLaughlin, D. E., & van der Marel, R. P. 2005, ApJS, 161, 304 [NASA ADS] [CrossRef] [Google Scholar]
- McWilliam, A. 1998, AJ, 115, 1640 [NASA ADS] [CrossRef] [Google Scholar]
- Milone, A. P., Bedin, L. R., Piotto, G., & Anderson, J. 2009, A&A, 497, 755 [NASA ADS] [CrossRef] [EDP Sciences] [Google Scholar]
- Mucciarelli, A., Origlia, L., Ferraro, F. R., Bellazzini, M., & Lanzoni, B. 2012, ApJ, 746, L19 [NASA ADS] [CrossRef] [Google Scholar]
- Niederhofer, F., Hilker, M., Bastian, N., & Silva-Villa, E. 2015, A&A, 575, A62 [NASA ADS] [CrossRef] [EDP Sciences] [Google Scholar]
- Olszewski, E. W., Schommer, R. A., Suntzeff, N. B., & Harris, H. C. 1991, AJ, 101, 515 [Google Scholar]
- Piatti, A. E., Pietrzyński, G., Narloch, W., Górski, M., & Graczyk, D. 2019, MNRAS, 483, 4766 [NASA ADS] [CrossRef] [Google Scholar]
- Piotto, G., Milone, A. P., Bedin, L. R., et al. 2015, AJ, 149, 91 [Google Scholar]
- Polidan, R. S., & Peters, G. J. 1976, IAUS, 70, 59 [NASA ADS] [Google Scholar]
- Portegies Zwart, S. F., McMillan, S. L. W., & Gieles, M. 2010, ARA&A, 48, 431 [NASA ADS] [CrossRef] [Google Scholar]
- Pryor, C., & Meylan, G. 1993, Structure and Dynamics of Globular Clusters, 50, 357 [NASA ADS] [Google Scholar]
- Rivinius, T., Carciofi, A. C., & Martayan, C. 2013, A&ARv., 21, 69 [NASA ADS] [CrossRef] [Google Scholar]
- Sneden, C. A. 1973, Ph.D. Thesis [Google Scholar]
- Song, Y.-Y., Mateo, M., Bailey, J. I., et al. 2021, MNRAS, 504, 4160 [NASA ADS] [CrossRef] [Google Scholar]
- Takeda, Y., & Honda, S. 2016, PASJ, 68, 32 [NASA ADS] [CrossRef] [Google Scholar]
- Takeda, Y., Han, I., Kang, D.-I., Lee, B.-C., & Kim, K.-M. 2008, J. Korean Astron. Soc., 41, 83 [NASA ADS] [CrossRef] [Google Scholar]
- Tody, D. 1986, Proc. SPIE, 627, 733 [NASA ADS] [CrossRef] [Google Scholar]
- Usher, C., Beckwith, T., Bellstedt, S., et al. 2019, MNRAS, 482, 1275 [Google Scholar]
- Van der Swaelmen, M., Hill, V., Primas, F., & Cole, A. A. 2013, A&A, 560, A44 [NASA ADS] [CrossRef] [EDP Sciences] [Google Scholar]
- Weilbacher, P. M., Palsa, R., Streicher, O., et al. 2020, A&A, 641, A28 [NASA ADS] [CrossRef] [EDP Sciences] [Google Scholar]
- Wisniewski, J. P., & Bjorkman, K. S. 2006, ApJ, 652, 458 [NASA ADS] [CrossRef] [Google Scholar]
All Tables
Radial velocities, metallicities, and Ba abundances of the 38 target RSGs of NGC 1850A.
All Figures
|
Fig. 1. Spatial distribution and photometric properties of target stars. Left panel: map of the analysed MUSE field. Sources with extracted spectra are marked by red dots. Middle and right panels: (F439W–F569W, F569W) (middle) and (F170W–F569W, F170W) CMDs of NGC 1850 (grey points). Target stars are marked by red dots. |
| In the text | |
|
Fig. 2. Example spectra of a few stars in our sample. Right panel: from top to bottom, example spectra of a blue loop star, a RSG, a blue supergiant, a MS, and a red giant. Left panel: (F439W–F569W, F569W) CMD of NGC 1850. The positions of the corresponding stars are indicated. The RSG stars of NGC 1850A selected for the kinematic (Sect. 3.1) and chemical (Sect. 3.2) analysis are marked by red dots. |
| In the text | |
|
Fig. 3. (F439W − F569W, F569W) (left) and (F170W − F569W, F170W) (right) CMDs of NGC 1850. Target stars associated with NGC 1850A, NGC 1850B, and the LMC are marked by red, blue, and green dots, respectively. The Marigo et al. (2008) isochrones with ages of 15 Myr, 90 Myr, and 10 Gyr are plotted in both panels with cyan, magenta, and black solid lines, respectively. We adopted the distance modulus (m − M)0 = 18.50 (Niederhofer et al. 2015) and the reddening E(B − V) = 0.13 (Górski et al. 2020). |
| In the text | |
|
Fig. 4. Kinematic fit of NGC 1850A. Left panel: projected density distribution of NGC 1850A. The best fit King (1966) model is overplotted. Middle panel: distribution of radial velocities of RSG stars as a function of the distance from the cluster centre. The 3σ boundary predicted by the best fit King (1966) model is overplotted. Right panel: distribution of radial velocities of the same sample as a function of the position angle. The best fit sinusoidal curve is overplotted. |
| In the text | |
|
Fig. 5. Example of 2D fit in the Teff − [M/H] plane for a sample RSG star. The probability map is shown in the bottom panel. The location of the peak and the 1, 2, and 3σ contours are shown. The spectrum fit along two projections are shown for different temperatures (top panel) and metallicities (middle panel; in this panel only a small portion of the spectrum is shown for better readability). |
| In the text | |
|
Fig. 6. EW of the O I triplet as a function of temperature for bright MS stars. The histograms for stars in the range 4.1 < log(Teff/K) < 4.2 in EW are also shown. |
| In the text | |
|
Fig. 7. (F439W − F569W)-F569W CMD of NGC 1850 stars with 3.5 < log g < 4.5. O-strong and O-weak stars are marked by black and red symbols, respectively. The colour histograms of both groups in the magnitude range 16 < F569W < 18 are shown in the inset panel. |
| In the text | |
|
Fig. 8. Comparison between the spectra of two O-strong (top panel) and O-weak (bottom panel) MS stars. The H lines as well as the O I triplet are indicated. |
| In the text | |
|
Fig. 9. EWs of hydrogen lines as a function of the O I triplet EW for the bright MS stars of NGC 1850. |
| In the text | |
|
Fig. 10. Rotational profiles of blue and red MSTO stars. Left panel: distribution of MSTO stars of NGC 1850A with 3.5 < log g < 4.5 and F569W < 18 in the F439W − F569W vs. EW(Hα) plane. Stars bluer and redder than F439W − F569W = −0.23 are marked by blue and red points, respectively, while Be stars are marked by black points. Right panel: average line profiles of the blue (blue line) and red (red line) samples. |
| In the text | |
Current usage metrics show cumulative count of Article Views (full-text article views including HTML views, PDF and ePub downloads, according to the available data) and Abstracts Views on Vision4Press platform.
Data correspond to usage on the plateform after 2015. The current usage metrics is available 48-96 hours after online publication and is updated daily on week days.
Initial download of the metrics may take a while.