Free Access
Fig. 1.
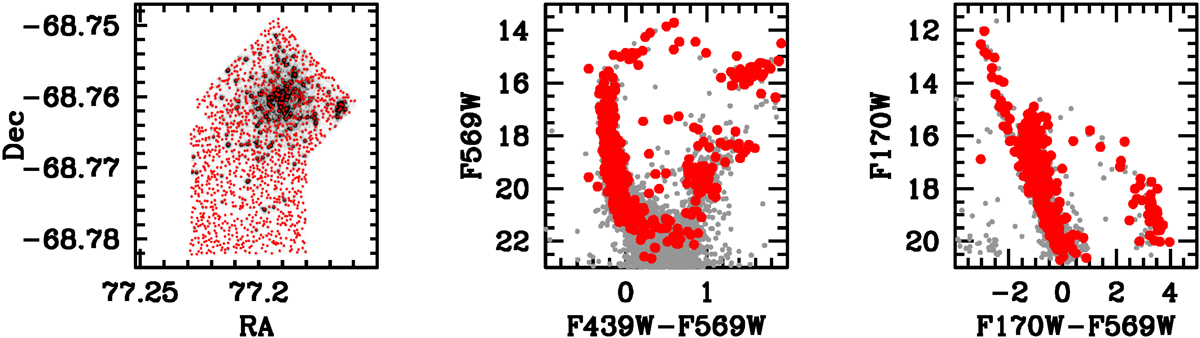
Download original image
Spatial distribution and photometric properties of target stars. Left panel: map of the analysed MUSE field. Sources with extracted spectra are marked by red dots. Middle and right panels: (F439W–F569W, F569W) (middle) and (F170W–F569W, F170W) CMDs of NGC 1850 (grey points). Target stars are marked by red dots.
Current usage metrics show cumulative count of Article Views (full-text article views including HTML views, PDF and ePub downloads, according to the available data) and Abstracts Views on Vision4Press platform.
Data correspond to usage on the plateform after 2015. The current usage metrics is available 48-96 hours after online publication and is updated daily on week days.
Initial download of the metrics may take a while.