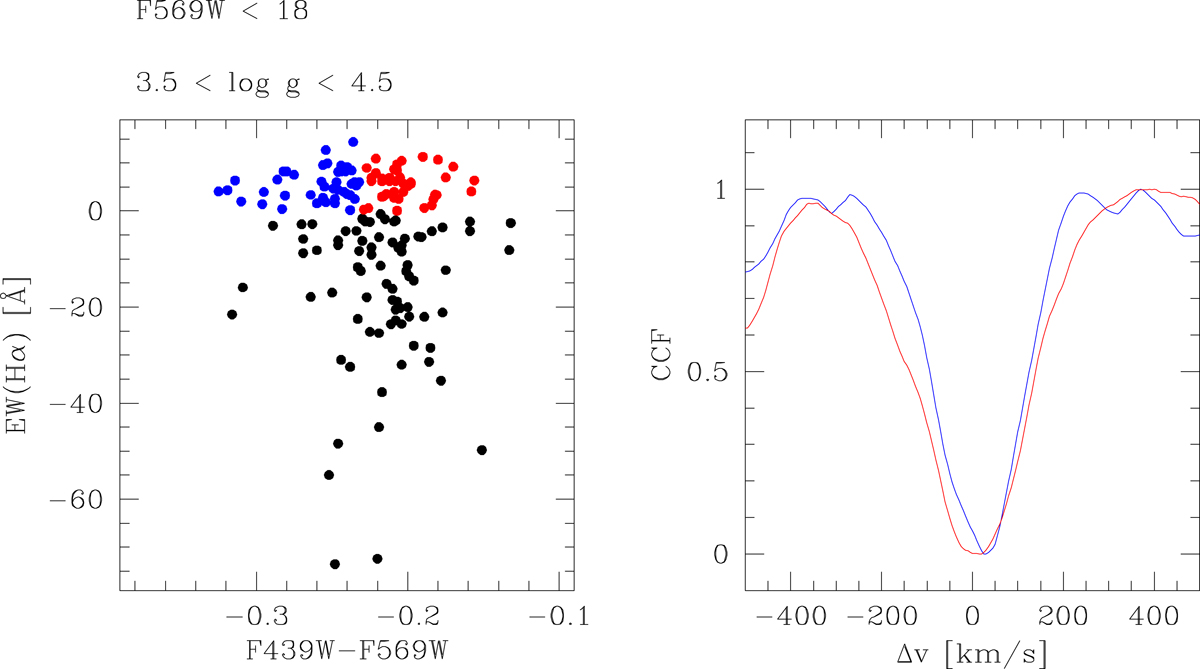
Fig. 10.
Download original image
Rotational profiles of blue and red MSTO stars. Left panel: distribution of MSTO stars of NGC 1850A with 3.5 < log g < 4.5 and F569W < 18 in the F439W − F569W vs. EW(Hα) plane. Stars bluer and redder than F439W − F569W = −0.23 are marked by blue and red points, respectively, while Be stars are marked by black points. Right panel: average line profiles of the blue (blue line) and red (red line) samples.
Current usage metrics show cumulative count of Article Views (full-text article views including HTML views, PDF and ePub downloads, according to the available data) and Abstracts Views on Vision4Press platform.
Data correspond to usage on the plateform after 2015. The current usage metrics is available 48-96 hours after online publication and is updated daily on week days.
Initial download of the metrics may take a while.