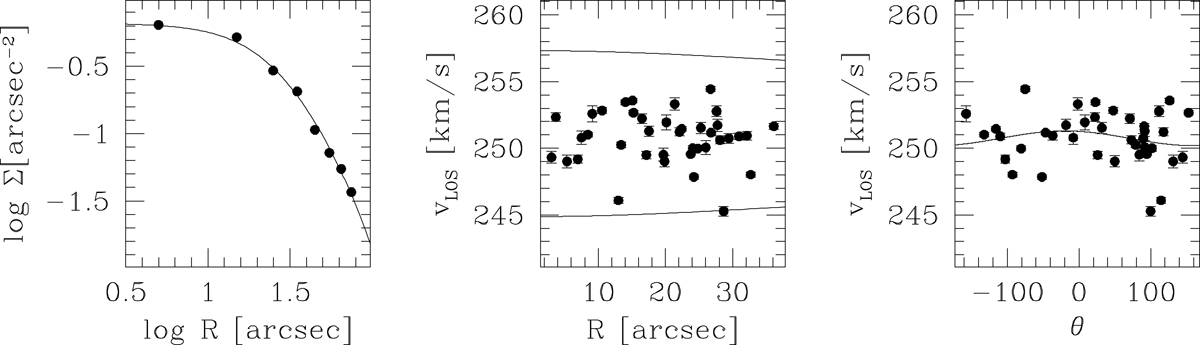
Fig. 4.
Download original image
Kinematic fit of NGC 1850A. Left panel: projected density distribution of NGC 1850A. The best fit King (1966) model is overplotted. Middle panel: distribution of radial velocities of RSG stars as a function of the distance from the cluster centre. The 3σ boundary predicted by the best fit King (1966) model is overplotted. Right panel: distribution of radial velocities of the same sample as a function of the position angle. The best fit sinusoidal curve is overplotted.
Current usage metrics show cumulative count of Article Views (full-text article views including HTML views, PDF and ePub downloads, according to the available data) and Abstracts Views on Vision4Press platform.
Data correspond to usage on the plateform after 2015. The current usage metrics is available 48-96 hours after online publication and is updated daily on week days.
Initial download of the metrics may take a while.