Free Access
Fig. 6.
Download original image
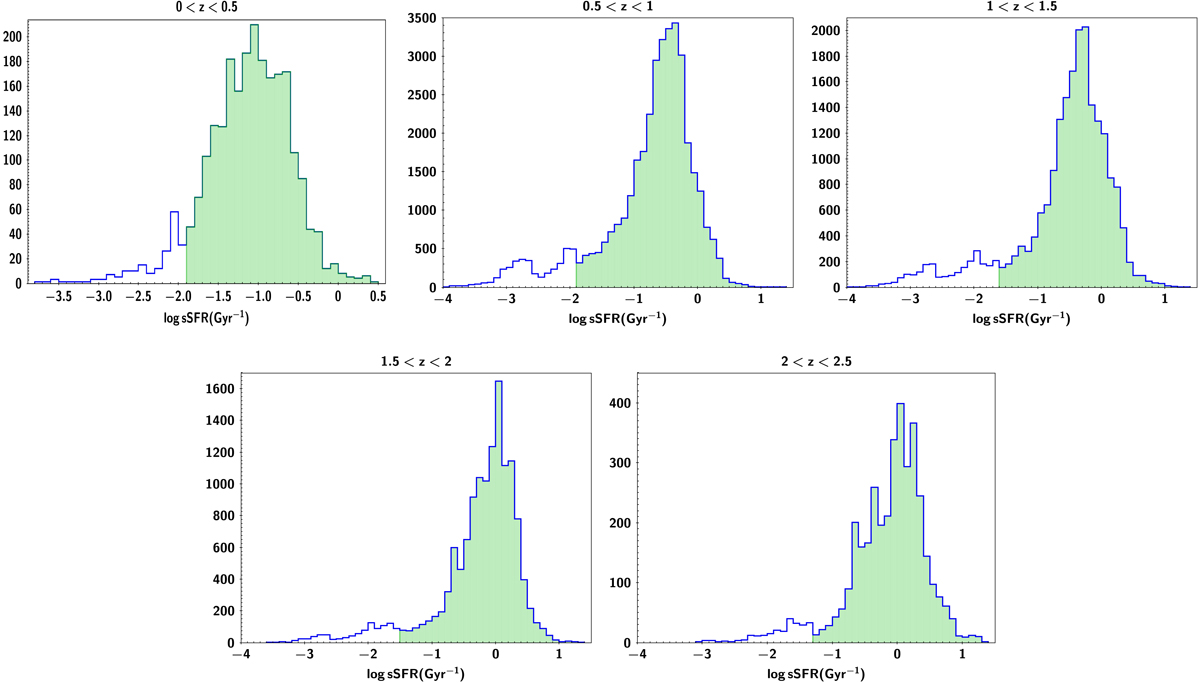
sSFR distributions of the reference galaxy sample, in five redshift intervals. Blue lines present the full distributions. Green areas are the sSFR distribution after applying the sSFR cut, which is defined based on the location of the second, lowest peak of each distribution.
Current usage metrics show cumulative count of Article Views (full-text article views including HTML views, PDF and ePub downloads, according to the available data) and Abstracts Views on Vision4Press platform.
Data correspond to usage on the plateform after 2015. The current usage metrics is available 48-96 hours after online publication and is updated daily on week days.
Initial download of the metrics may take a while.