Fig. 4.
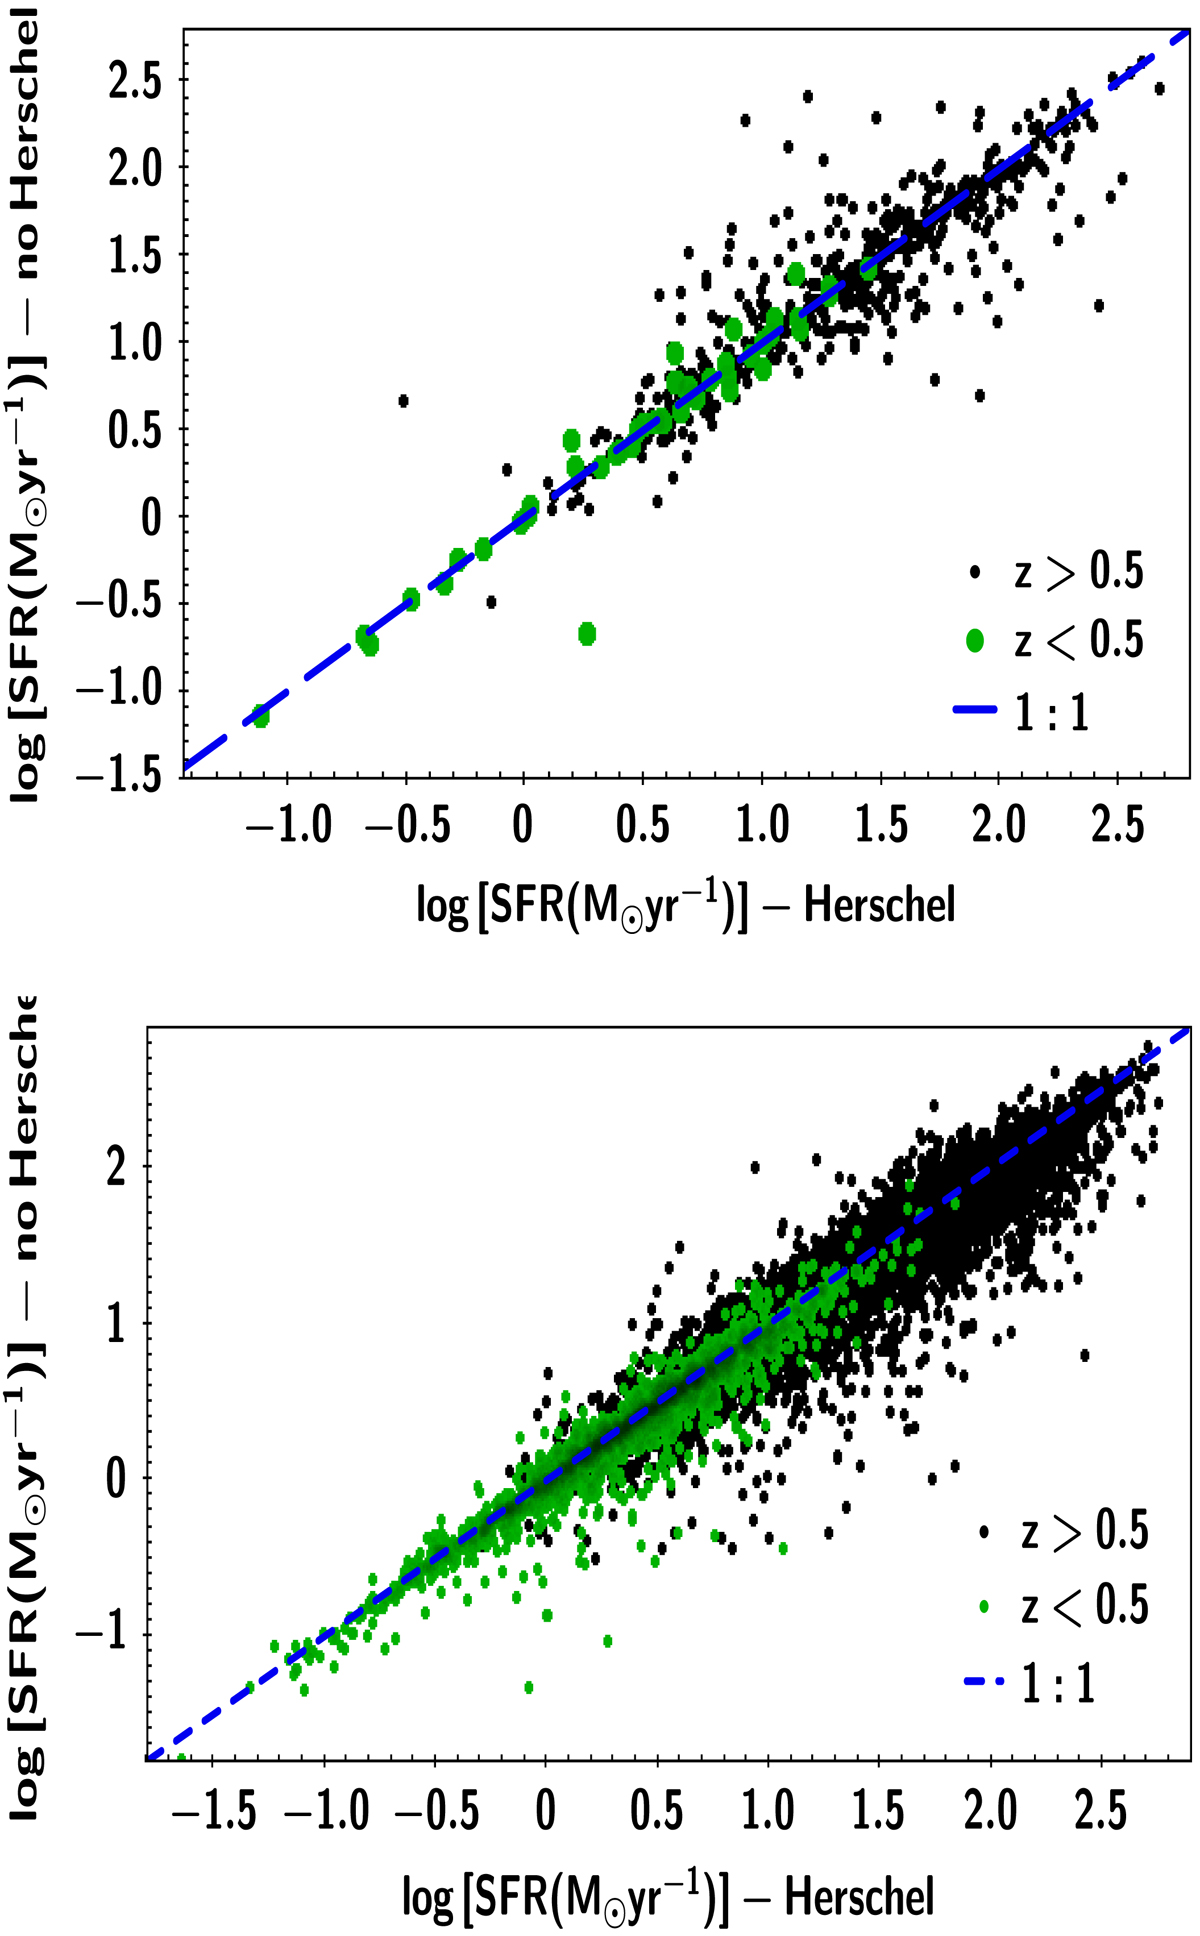
Download original image
Comparison of SFR measurements with and without Herschel. Top panel: SFR calculations for 742 X-ray AGN with available FIR photometry. The blue dashed line presents the 1:1 relation. Sources at z > 0.5 are shown with black circles, while those at z < 0.5 are shown with green circles. The mean difference of the SFR calculations is 0.01 for the overall population (0.00 for sources at z < 0.5) and the dispersion is 0.25 (0.19 at z < 0.5). Bottom panel: SFR measurements with and without Herschel for sources in the galaxy reference catalogue. The mean difference of the SFR calculations is 0.05 for the overall population (0.04 for sources at z < 0.5) and the dispersion is 0.16 (0.13 at z < 0.5).
Current usage metrics show cumulative count of Article Views (full-text article views including HTML views, PDF and ePub downloads, according to the available data) and Abstracts Views on Vision4Press platform.
Data correspond to usage on the plateform after 2015. The current usage metrics is available 48-96 hours after online publication and is updated daily on week days.
Initial download of the metrics may take a while.