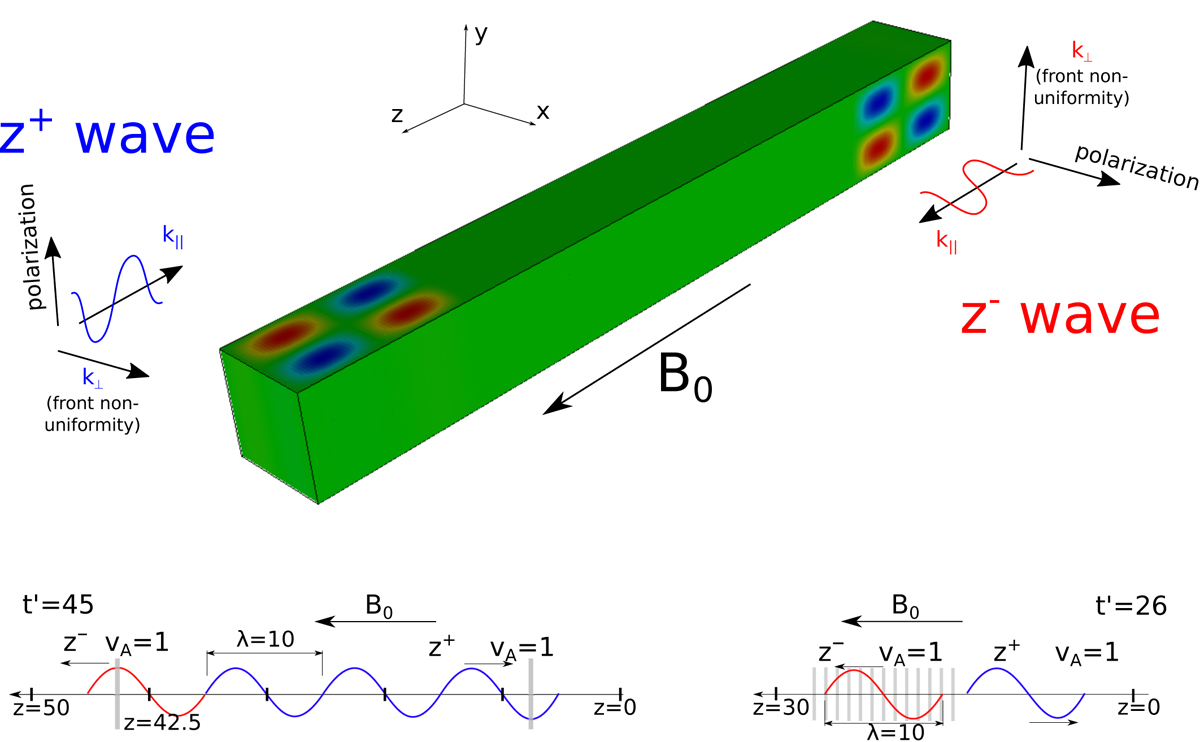
Fig. 1.
Download original image
General picture of the numerical setup for AW collision. Top: physical setup; early phase. The green rectangle denotes the numerical box with equilibrium plasma, the red and blue areas represent velocity perturbations (positive and negative) of the z− wave (far boundary) and z+ wave (near boundary). Polarization planes and nonuniformity directions are annotated. Bottom: longitudinal sketches; late phase after AW collision. Main setups with one period in z− and three periods in the z+ wave (left), and complimentary setups with one period in each wave (right). The gray areas denote cross-sections taken for further analysis.
Current usage metrics show cumulative count of Article Views (full-text article views including HTML views, PDF and ePub downloads, according to the available data) and Abstracts Views on Vision4Press platform.
Data correspond to usage on the plateform after 2015. The current usage metrics is available 48-96 hours after online publication and is updated daily on week days.
Initial download of the metrics may take a while.