| Issue |
A&A
Volume 661, May 2022
The Early Data Release of eROSITA and Mikhail Pavlinsky ART-XC on the SRG mission
|
|
|---|---|---|
| Article Number | A33 | |
| Number of page(s) | 5 | |
| Section | Stellar structure and evolution | |
| DOI | https://doi.org/10.1051/0004-6361/202141813 | |
| Published online | 18 May 2022 | |
Losing a minute every two years: SRG X-ray view of the rapidly accelerating X-ray pulsar SXP 1323
1
Space Research Institute, Russian Academy of Sciences,
Profsoyuznaya 84/32,
117997
Moscow,
Russia
e-mail: This email address is being protected from spambots. You need JavaScript enabled to view it.
2
Leiden Observatory, Leiden University,
2300RA
Leiden,
The Netherland
3
Department of Physics and Astronomy, 20014 University of Turku,
Finland
Received:
16
July
2021
Accepted:
24
November
2021
Abstract
The source SXP 1323 is a peculiar high-mass X-ray binary located in the Small Magellanic Cloud. It is renowned for its rapid spin-up. We investigate for the first time broadband X-ray properties of SXP 1323 as observed by the Mikhail Pavlinsky ART-XC and eROSITA telescopes on board the Spectrum-Roentgen-Gamma observatory. Using ART-XC and eROSITA data, we produced a first broadband 1−20 keV X-ray spectrum and estimated the pulsed fraction box 8 keV. With the addition of archival XMM-Newton observations, we traced the evolution of the spin period of SXP 1323 over the last five years and found that after 2016, the source switched to a linear spin-up with a rate of −29.9 s yr−1. The broadband X-ray spectrum is typical for accreting X-ray pulsars. It has a steep power-law index (Γ = −0.15) and an exponential cutoff energy of 5.1 keV. No significant difference between spectra obtained in states with and without pulsations were found.
Key words: X-rays: binaries / accretion, accretion disks / magnetic fields / X-rays: individuals: SXP1323 / stars: neutron / pulsars: general
© ESO 2022
1 Introduction
The Small Magellanic Cloud (SMC) is a nearby irregular galaxy (located at 62 kpc; Scowcroft et al. 2016), which has undergone a major star formation event about 50 Myr ago (Shtykovskiy & Gilfanov 2007). This event resulted in the birth of a large population of high-mass X-ray binaries (HMXBs; see, e.g., Haberl & Sturm 2016; Haberl et al. 2022) that have been intensively observed over the past decades with various X-ray instruments (e.g., Cowley et al. 1997; Laycock et al. 2010; Haberl et al. 2012, and others), including the modern X-ray telescopes Mikhail Pavlinsky Astronomical Roentgen Telescope − X-ray Concentrator (ART-XC; Pavlinsky et al. 2021) and the extended ROentgen Survey with an Imaging Telescope (eROSITA; Predehl et al. 2021) on board the Spectrum-Roentgen-Gamma mission (SRG; Sunyaev et al. 2021).
During the performance and verification phase, eROSITA observed the supernova remnant (SNR) 1E0102−72.2, which is commonly used as a calibration target in soft X-rays. These observations were performed as a sequence of pointings. During several of them, the bright X-ray pulsar SXP 1323 was serendipitously observed by ART-XC.
In this paper we report the first investigation of the SXP 1323 broadband spectrum and its variability using ART-XC and eROSITA data. We also employed archival XMM-Newton observations to trace the change in pulse period over the last five years.
2 SXP 1323
The source SXP 1323 was first detected in X-rays by the ROSAT observatory (Sasaki et al. 2000; Haberl et al. 2000) and was proposed as an X-ray binary system with a Be companion (BeXRB) based on the positional coincidence with the bright Hα emission-line star (Haberl & Sasaki 2000). Later, Haberl & Pietsch (2005) discovered coherent pulsations from the source with a period of ≈ 1323 s, which mean that this system is one of the slowest BeXRB known. Using Suzaku, XMM-Newton, and Chandra, Carpano et al. (2017) found a 26.2-day variability, which they identified as an orbital period. It is interesting to note that this period is unusually short for such systems: based on the Corbet relation (Corbet 1986), an orbital period of about 300 days is expected. The orbital modulation is clearly seen in X-rays and leads to variations in the source luminosity from 1035 to a few ×1036 erg s−1. An equivalent width of the Hα line of the optical companion of SXP 1323 follows the known Porb−Hα correlation (Reig et al. 1997), thus confirming the identification of 26.2-day period as the orbital period (Gvaramadze et al. 2019).
Carpano et al. (2017) reported a peculiar evolution of the neutron star (NS) spin period, which was relatively stable during 2003−2006 and then started to spin up very rapidly, with steady P ≃ −21.65 s yr−1. This makes SXP 1323 one of three pulsars with exceptionally high observed spin-up rates, along with SXP 1062 (Hénault-Brunet et al. 2012; Tsygankov et al. 2020) and NGC 300 ULX-1 (Carpano et al. 2018; Vasilopoulos et al. 2019). A similar behavior in the form of a transition from a plateau to a rapid spin-up was also observed in the long-period BeXRB 2RXP J130159.6-635806 (Krivonos et al. 2015). Another peculiar trait of SXP 1323 noted by Carpano et al. (2017) is the disappearance of the pulsations in 2010-2014, which was not accompanied by a dramatic change in luminosity.
In archival Hα images, Gvaramadze et al. (2019) found a bright circular shell, which they proposed as an SNR that was created during the formation of SXP 1323. Later, the SNR nature of the shell was confirmed based on deep radio and X-ray imaging (Maggi et al. 2019). If this association is correct, it allows us to estimate the age of SXP 1323 to (25–40) × 103 yr, making it one of the youngest known BeXRBs with a visible SNR (see Maitra et al. 2021, for a list of known XRBs with associated SNRs).
3 X-ray observations
We analyzed the ART-XC observation of 1E 0102.2–7219 (ObsID: 70000100100, see Table 1 for details) that was performed in 2019. According to the orbital solution obtained by Carpano et al. (2017), our observation occurred at an orbital phase of ≈0.7, corresponding to the maximum X-ray brightness of the system. In this state, the observed 0.3–10 keV luminosity reaches (1–2) × 1036 erg s−1 and the source spectrum becomes harder, which provides optimal conditions for the ART-XC observations.
ART-XC data were processed with the standard pipeline ARTPRODUCTS v0.9 with the CALDB version 20200401. Although ART-XC works in the broad 4–30 keV energy band, we used only the 5–22 keV range for the spectral analysis because a significant source detection box 22 keV is lacking. We also produced the source light curves in the 4–8, 4–12, and 8–16 keV energy bands for the timing analysis.
The SNR 1E 0102.2–7219 itself was not detected in the ART-XC data box 5 keV. Nevertheless, we explicitly checked that the SNR does not contribute to the SXP1323 spectrum. First, the nearest part of the shell is located ≈1′.5 away from the position of SXP 1323, and therefore the ART-XC point-spread function is enough to resolve it spatially. This limits a possible contribution from the SNR. Next, we estimated the hard X-ray flux from the SNR using a standard spectral model for this object (Plucinsky et al. 2017). Its overall flux is about F5−10 kev ≈ 8 × 10⁻¹⁴ erg cm−2 s−1, which is lower by more than an order of magnitude than the flux registered from SXP 1323.
In order to extend our analysis to soft X-rays, we extracted the source spectrum from the simultaneous eROSITA observation using the eSASS package (Brunner et al. 2022). Because of the possible contribution from 1E 0102.2–7219 at low energies and the variable soft component (Carpano et al. 2017), we limited the eROSITA data to the 1–7 keV range. Source spectrum and background were extracted from regions with a radius of 25″, located at same distance from the center of SNR 1E 0102.2–7219. Spectra from seven telescope modules were joined together and grouped in order to have at least 30 counts per energy bin. The source light curves in the 1–4 and 4–8 energy bands were extracted from the same aperture.
We also extracted the spectrum from the XMM-Newton EPIC-pn observation 0412981001, obtained in 2010, when no pulsations were detected from the source (Carpano et al. 2017). This observation was taken at an orbital phase of 0.54, close to the phase of the SRG observation. The spectrum was extracted from the aperture with r = 10″ in the 1–10 keV energy band using XMM SAS v19 and corresponding calibration files. We did not use EPIC-pn data box 1 keV for similar reasons as for eROSITA. The spectrum was grouped in order to have at least 30 counts per energy bin. All spectra were fit using the χ2 statistics in XSPEC (Arnaud 1996).
One of the most interesting properties of this pulsar is its spin evolution. As was shown by Carpano et al. (2017), after 2006, SXP 1323 began to spin up at an impressive rate of P ≃ −21.65 s yr−1 and continued to accelerate until 2017. In order to trace this behavior after 2017, we measured the spin period in a few XMM-Newton observations performed in 2016−2020 (ObsIDs 0412983201, 0412983401, 0810880101, and 0810880601). For these observations, we extracted barycentered source light curves in the 1–10 keV energy band, with excluded periods of an enhanced particle background.
X-ray observations used for spectral analysis.
4 Results
4.1 X-ray spectrum
ART-XC is the first grazing incidence telescope ever to observe SXP 1323 at energies box 10 keV. This provides the possibility of characterizing the source broadband spectrum better.
Following the spectral analysis by Carpano et al. (2017), we tried to fit a joint ART-XC+ eROSITA spectrum in the 1–22 keV energy band with a simple const*phabs*vphabs*powerlaw model in the XSPEC package. The multiplicative constant allowed us to take the difference in the calibrations between eROSITA and ART-XC into account. The phabs component, describing the Galactic absorption, was fixed at the value of NH = 5.36 × 1020 cm−2 (Dickey & Lockman 1990), while the vphabs component, responsible for the local SMC absorption, was allowed to be variable with fixed abundances of all elements (AHe = 1, Az>2 = 0.2, Russell & Dopita 1992). This model obviously overpredicts the hard X-ray flux box ≈ 10 keV. Therefore, we added an exponential cutoff at higher energies (const*phabs*vphabs*cutoffpl), as is usually observed in X-ray pulsars (see, e.g. Coburn et al. 2002; Filippova et al. 2005).
Figure 1 shows that the resulting model provides a good approximation of the SXP 1323 spectrum with χ2/d.o.f. = 498.4/444. The model was insensitive to the local SMC absorption, with only an upper limit on the hydrogen column density of 5 × 1020 cm−2. We therefore fixed it at 1020 cm−2. The photon index was measured to be  (hereafter, all errors are reported at the 90% confidence level), and the cutoff energy at
  keV. No obvious features were detected that could be ascribed to a cyclotron absorption line. The total unabsorbed bolometric luminosity, estimated over the 0.1–100 keV energy band, is 4 × 1036 erg s−1.
It was proposed by Christodoulou et al. (2018) that the NS magnetic field in SXP 1323 is relatively weak, box 1011 G, and was crushed by the infalling material at some moment in about 2005 and still has not recovered. Changes in the magnetosphere configuration might be expected to eventually lead to changes in the observed X-ray spectrum. It is interesting therefore to compare the X-ray spectrum of SXP 1323 that was observed during the lack-of-pulsation phase with the observed joint ART-XC + eROSITA spectrum. For this comparison, we used the XMM-Newton observation 0412981001. The resulting spectrum is well described with a similar phabs*vphabs*powerlaw model in the 1–10 keV band, and no additional components are required. The spectrum is hard (Γ ≈ 1), and the absorption column is significantly higher (NH ≈ 2 × 1022 cm−2), as expected from the observed orbital modulation. It is close to the parameters derived by Carpano et al. (2017). We therefore conclude that the spectral shape during the nonpulsation episode did not alter dramatically.
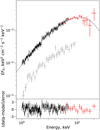 |
Fig. 1 Joint ART-XC + eROSITA spectrum of SXP 1323. Black points correspond to the eROSITA data, and red points show ART-XC measurements. Spectra from seven ART-XC modules were grouped together and rebinned for clarity. Gray points show the XMM-Newton source spectrum obtained in 2010, when no pulsations were detected. |
4.2 Pulsations: Spin-up rate and pulsed fraction
In order to trace the spin-up history of SXP 1323 in 2016–2020, we searched for periods in the ART-XC and XMM-Newton light curves using a simple epoch-folding technique (Leahy et al. 1983). Pulsations were clearly detected in all observations, with periods ranging from 1094 to 976 seconds, correspondingly. In order to estimate an uncertainty for the period determination, we performed many simulations for each light curve using the observed count statistics of the pulse profile as input (see details in Boldin et al. 2013). We used boundaries of a 90% interval. We also accounted for the uncertainty caused by the orbital motion of the NS and found that in the worst-case scenario (high inclination and high eccentricity), it could be about 1 s.
Figure 2 shows the long-term evolution of the spin period along with the best-fit linear model with a spin-up rate of Ṗ = −29.9 + 0.5 s yr−1. This value is significantly higher than the value reported by Carpano et al. (2017) over the 2006−2016 period (Ṗ = −21.65 s yr−1). This might indicate that in some moment after 2014, the source switched to the linear and faster spin-up.
It is also interesting to study the source pulse profile at different energies. In Fig. 3 we present pulse profiles in three broad energy bands as seen by eROSITA and ART-XC. The eROSITA pulse profiles are shown in the 1–4 and 4–8 keV energy bands, and the ART-XC profiles are in the 4–8 and 8–16 keV bands. In the lowest-energy band, the pulse profile demonstrates complex shape, while at higher energies it is simpler, with characteristic single-peaked structure. At the highest energies, the maximum becomes narrower, with a less prominent right shoulder (see also Fig. 1 in Yang et al. 2018).
We calculated the pulsed fraction as specified in Yang et al. (2018),
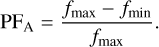 (1)
(1)
The dependence of the pulsed fraction on energy clearly increases from ~25% in the 1–4 keV energy band to ~38% in the 4–8 keV band and to a similar value at higher (8–16 keV) energies. The observed PFA,4−8kev ≈ 0.38 is close to the PFA measured in the archival Chandra and XMM-Newton data by Yang et al. (2018) at similar orbital phases.
Alternatively, we also estimated the pulsed fractions in the standard way as
 (2)
(2)
The obtained values PF1−4keV ≈ 13% and PF4−8keV ≈ PF8−16kev ≈ 23% are slightly lower than mentioned box, but have the same tendency.
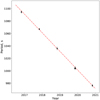 |
Fig. 2 Long-term period evolution of SXP 1323. Circles show XMM-Newton measurements, and the triangle denotes ART-XC data. The dash-dotted line shows the best-fit approximation with a spin-up of −29.9 s yr−1. |
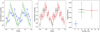 |
Fig. 3 Pulse profile and pulsed fraction in different energy bands. Left panel: profile in the 1–4 keV (blue) and 4–8 keV (green) band as seen by eROSITA. Middle panel: profile in the 4–8 keV (black) and 8–16 keV (red) band as observed by ART-XC. Right panel: pulsed fraction PFA, calculated as in Eq. (1). |
5 Discussion
The SRG observations provide the first ever high-quality broadband X-ray spectrum of SXP 1323. It is quite common for accreting NSs in high-mass X-ray binaries. The spin-up history of this peculiar source is far less common. After the plateau in the early 2000s, the source started to spin up very rapidly. According to our measurements over last five years, the source accelerates at an even higher rate of Ṗ ≃ −30 s yr−1. This high acceleration rate of the rotation of the NS at a rather low luminosity allows us to make theoretical assumptions and estimates of the physical processes of the accretion in this system.
First of all, long-term observations of the spin period derivative available to date in SXP 1323 enable estimating the dipole component of the NS magnetic field. In the case of accretion through the disk, the spin period derivative is determined by the mass accretion rate M, the current spin period P, the moment of inertia of the NS I, and the radius of the accretion disk Rm,
 (3)
(3)
where B12 is the magnetic field strength B at the NS poles in units of 1012 G, M17 is the mass accretion rate M in units of 1017 g s−1, m is the mass of an NS M in solar masses, R6 is the NS radius R in units of 106 cm, and Λ is a constant depending on the accretion flow geometry: Λ = 1 for the spherical accretion and Λ < 1 for the accretion from the disk, with Λ = 0.5 being a commonly used value (see, e.g., Frank et al. 2002). The torques affecting the NS angular momentum J and spin period have two contributions: the contribution associated with the mass accretion onto the stellar surface (Pringle & Rees 1972),
 (4)
(4)
and the contribution related to the disk-star coupling Km,
 (5)
(5)
The magnetic torque can be either positive or negative, depending on the location of the interaction zone relative to the corota-tion radius. If the magnetospheric radius is located deep inside the magnetosphere of an NS, the magnetic torque in Eq. (5) can be neglected. Then we obtain an estimation for the surface B-field strength,
 (6)
(6)
where P3 is the NS spin period P in units of 103 s, and I45 is the NS moment of inertia in units of 1045 g cm2. Using the observed spin period and spin period derivative, and estimating the average mass accretion rate as Mave ≈ 1016 gs−1, we obtain a rough estimate of the surface magnetic field strength of B ~ few × 1013 G.
The physics of the magnetic torque is complicated and uncertain (see, e.g., Lai 2014; Parfrey et al. 2016). According to the model by Ghosh & Lamb (1978), the net total torque on the NS can be represented as
 (7)
(7)
where
 (8)
(8)
where the fastness parameter is ωs = (Rm/Rc)3/2, and the critical frequency is ωc ≈ 0.8 (Lamb et al. 1988). A direct application of this model to the data gives B ≈ 6 × 10¹³ G.
These two estimates are only approximate and strongly depend on the exact geometry of the accretion flow and displacement of the inner radius of the accretion disk (this uncertainty is included in the parameter Λ). Nevertheless, the obtained estimate of the field strength allows us to conclude that the source is always in the subcritical regime of accretion when the radiation pressure is not strong enough to affect the accretion flow significantly box the NS surface (Basko & Sunyaev 1976; Mushtukov et al. 2015). An X-ray pulsar with a surface field strength > 1013 G and spin period of ~ 1000 s cannot turn into the “propeller” state if it accretes from the disk. Instead, it turns into the state of stable accretion from the cold disk that is composed of the recombined material (Tsygankov et al. 2017).
However, the physical picture in SXP 1323 can be more complicated by the short orbital period and the relatively small separation between the components in the binary system. According to numerical simulations (Martin et al. 2014), the decretion disk around the Be companion can be disturbed by the NS. In this case, the decretion disk around the Be star and the accretion disk around the NS are not necessarily aligned with the orbital plane, and it might be speculated that the orientation of the disk can vary in time. The standard torque models assume an alignment between spin axis of the accretion disk and the NS. If the angle between the two axes is nonzero, the accretion process mainly affects the component of the NS angular momentum that is aligned with the axis of the accretion disk. Then the spin period behavior reported by Carpano et al. (2017) is observed, when NS spin-down switches to NS spin-up with a small but nonzero spin frequency change between these two stages. The minimum spin frequency variations observed by Carpano et al. (2017) in this case correspond to the situation in which the rotational axis of the NS belongs to the plane of the accretion disk. Variations in NS spin-axis direction can, in principle, cause variations in the pulsed fraction, and as a result, the disappearance of pulsations detected in 2010–2014 by Carpano et al. 2017 (this statement requires numerical confirmation, however).
Taking the short orbital period of SXP 1323 and the nature of the companion star into account, we cannot exclude a contribution of a collimated (by the NS orbital motion) wind accretion onto the NS surface (see, e.g., El Mellah et al. 2019). Accounting for the wind accretion changes the estimate of the magneto-spheric radius and slightly changes the estimates for the B-field strength.
The uncertainties in the magnetic field estimations can be clarified by further observations of the spin period evolution, where we expect the appearance of a measurable second spin period derivative. This additional information can be obtained from investigating X-ray spectra in a low-luminosity state at energies > 10 keV. Recently, it has been shown that the spectra of X-ray pulsars with strong surface magnetic fields experience dramatic changes at very low-mass accretion rates (Tsygankov et al. 2019b,a; Mushtukov et al. 2021; Lutovinov et al. 2021; Sokolova-Lapa et al. 2021), and the analysis of the broadband X-ray spectra can help to restrict the magnetic field strength.
Acknowledgements
The authors are grateful to anonymous referee for useful comments. This work is based on the data from Mikhail Pavlinsky ART-XC and eROSITA X-ray instruments on board the SRG observatory. The SRG observatory was built by Roskosmos in the interests of the Russian Academy of Sciences represented by its Space Research Institute (IKI) in the framework of the Russian Federal Space Program, with the participation of the Deutsches Zentrum für Luft- und Raumfahrt (DLR). The ART-XC team thanks the Russian Space Agency, Russian Academy of Sciences and State Corporation Rosatom for the support of the SRG project and ART-XC telescope and the Lavochkin Association (NPOL) with partners for the creation and operation of the SRG spacecraft (Navigator). The eROSITA X-ray telescope was built by a consortium of German Institutes led by MPE, and supported by DLR. The science data are downlinked via the Deep Space Network Antennae in Bear Lakes, Ussurijsk, and Baykonur, funded by Roskosmos. The eROSITA data used in this work were processed using the eSASS software system developed by the German eROSITA consortium. This work was supported by the grant of the Ministry of Science and Higher Education of the Russian Federation 14.W03.31.0021.
References
- Arnaud, K. A. 1996, ASP Conf. Ser., 101, 17 [Google Scholar]
- Basko, M. M., & Sunyaev, R. A. 1976, MNRAS, 175, 395 [Google Scholar]
- Boldin, P. A., Tsygankov, S. S., & Lutovinov, A. A. 2013, Astron. Lett., 39, 375 [NASA ADS] [CrossRef] [Google Scholar]
- Brunner, H., Liu, T., Lamer, G., et al. 2022, A&A, 661, A1 (eROSITA EDR SI) [NASA ADS] [CrossRef] [EDP Sciences] [Google Scholar]
- Carpano, S., Haberl, F., & Sturm, R. 2017, A&A, 602, A81 [NASA ADS] [CrossRef] [EDP Sciences] [Google Scholar]
- Carpano, S., Haberl, F., Maitra, C., & Vasilopoulos, G. 2018, MNRAS, 476, L45 [NASA ADS] [CrossRef] [Google Scholar]
- Christodoulou, D. M., Laycock, S. G. T., & Kazanas, D. 2018, MNRAS, 478, 3506 [NASA ADS] [CrossRef] [Google Scholar]
- Coburn, W., Heindl, W. A., Rothschild, R. E., et al. 2002, ApJ, 580, 394 [NASA ADS] [CrossRef] [Google Scholar]
- Corbet, R. H. D. 1986, MNRAS, 220, 1047 [NASA ADS] [CrossRef] [Google Scholar]
- Cowley, A. P., Schmidtke, P. C., McGrath, T. K., et al. 1997, PASP, 109, 21 [NASA ADS] [CrossRef] [Google Scholar]
- Dickey, J. M., & Lockman, F. J. 1990, ARA&A, 28, 215 [Google Scholar]
- El Mellah, I., Sundqvist, J. O., & Keppens, R. 2019, A&A, 622, L3 [NASA ADS] [CrossRef] [EDP Sciences] [Google Scholar]
- Filippova, E. V., Tsygankov, S. S., Lutovinov, A. A., & Sunyaev, R. A. 2005, Astron. Lett., 31, 729 [NASA ADS] [CrossRef] [Google Scholar]
- Frank, J., King, A., & Raine, D. J. 2002, Accretion Power in Astrophysics, 3rd edn. (Cambridge: Cambridge University Press) [Google Scholar]
- Ghosh, P., & Lamb, F. K. 1978, ApJ, 223, L83 [Google Scholar]
- Gvaramadze, V. V., Kniazev, A. Y., & Oskinova, L. M. 2019, MNRAS, 485, L6 [NASA ADS] [CrossRef] [Google Scholar]
- Haberl, F., Filipović, M. D., Pietsch, W., & Kahabka, P. 2000, A&AS, 142, 41 [NASA ADS] [CrossRef] [EDP Sciences] [Google Scholar]
- Haberl, F., Maitra, C., Carpano, S., et al. 2022, A&A, 661, A25 (eROSITA EDR SI) [NASA ADS] [CrossRef] [EDP Sciences] [Google Scholar]
- Haberl, F., & Pietsch, W. 2005, A&A, 438, 211 [NASA ADS] [CrossRef] [EDP Sciences] [Google Scholar]
- Haberl, F., & Sasaki, M. 2000, A&A, 359, 573 [NASA ADS] [Google Scholar]
- Haberl, F., & Sturm, R. 2016, A&A, 586, A81 [NASA ADS] [CrossRef] [EDP Sciences] [Google Scholar]
- Haberl, F., Sturm, R., Ballet, J., et al. 2012, A&A, 545, A128 [NASA ADS] [CrossRef] [EDP Sciences] [Google Scholar]
- Hénault-Brunet, V., Oskinova, L. M., Guerrero, M. A., et al. 2012, MNRAS, 420, L13 [NASA ADS] [Google Scholar]
- Krivonos, R. A., Tsygankov, S. S., Lutovinov, A. A., et al. 2015, ApJ, 809, 140 [NASA ADS] [CrossRef] [Google Scholar]
- Lai, D. 2014, Eur. Phys. J. Conf., 64, 01001 [NASA ADS] [CrossRef] [EDP Sciences] [Google Scholar]
- Lamb, R. C., Cawley, M. F., Fegan, D. J., et al. 1988, ApJ, 328, L13 [NASA ADS] [CrossRef] [Google Scholar]
- Laycock, S., Zezas, A., Hong, J., Drake, J. J., & Antoniou, V. 2010, ApJ, 716, 1217 [NASA ADS] [CrossRef] [Google Scholar]
- Leahy, D. A., Darbro, W., Elsner, R. F., et al. 1983, ApJ, 266, 160 [NASA ADS] [CrossRef] [Google Scholar]
- Lutovinov, A., Tsygankov, S., Molkov, S., et al. 2021, ApJ, 912, 17 [Google Scholar]
- Maggi, P., Filipović, M. D., Vukotić, B., et al. 2019, A&A, 631, A127 [NASA ADS] [CrossRef] [EDP Sciences] [Google Scholar]
- Maitra, C., Haberl, F., Maggi, P., et al. 2021, MNRAS, 504, 326 [NASA ADS] [CrossRef] [Google Scholar]
- Martin, R. G., Nixon, C., Armitage, P. J., Lubow, S. H., & Price, D. J. 2014, ApJ, 790, L34 [Google Scholar]
- Mushtukov, A. A., Suleimanov, V. F., Tsygankov, S. S., & Poutanen, J. 2015, MNRAS, 447, 1847 [NASA ADS] [CrossRef] [Google Scholar]
- Mushtukov, A. A., Suleimanov, V. F., Tsygankov, S. S., & Portegies Zwart, S. 2021, MNRAS, 503, 5193 [Google Scholar]
- Parfrey, K., Spitkovsky, A., & Beloborodov, A. M. 2016, ApJ, 822, 33 [NASA ADS] [CrossRef] [Google Scholar]
- Pavlinsky, M., Tkachenko, A., Levin, V., et al. 2021, A&A, 650, A42 [EDP Sciences] [Google Scholar]
- Plucinsky, P. P., Beardmore, A. P., Foster, A., et al. 2017, A&A, 597, A35 [NASA ADS] [CrossRef] [EDP Sciences] [Google Scholar]
- Predehl, P., Andritschke, R., Arefiev, V., et al. 2021, A&A, 647, A1 [EDP Sciences] [Google Scholar]
- Pringle, J. E., & Rees, M. J. 1972, A&A, 21, 1 [NASA ADS] [Google Scholar]
- Reig, P., Fabregat, J., & Coe, M. J. 1997, A&A, 322, 193 [NASA ADS] [Google Scholar]
- Russell, S. C., & Dopita, M. A. 1992, ApJ, 384, 508 [NASA ADS] [CrossRef] [Google Scholar]
- Sasaki, M., Haberl, F., & Pietsch, W. 2000, A&AS, 147, 75 [NASA ADS] [CrossRef] [EDP Sciences] [Google Scholar]
- Scowcroft, V., Freedman, W. L., Madore, B. F., et al. 2016, ApJ, 816, 49 [NASA ADS] [CrossRef] [Google Scholar]
- Shtykovskiy, P. E., & Gilfanov, M. R. 2007, Astron. Lett., 33, 437 [NASA ADS] [CrossRef] [Google Scholar]
- Sokolova-Lapa, E., Gornostaev, M., Wilms, J., et al. 2021, A&A, 651, A12 [NASA ADS] [CrossRef] [EDP Sciences] [Google Scholar]
- Sunyaev, R., Arefiev, V., Babyshkin, V., et al. 2021, A&A, 656, A132 [NASA ADS] [CrossRef] [EDP Sciences] [Google Scholar]
- Tsygankov, S. S., Mushtukov, A. A., Suleimanov, V. F., et al. 2017, A&A, 608, A17 [NASA ADS] [CrossRef] [EDP Sciences] [Google Scholar]
- Tsygankov, S. S., Doroshenko, V., Mushtukov, A. A., et al. 2019a, MNRAS, 487, L30 [NASA ADS] [CrossRef] [Google Scholar]
- Tsygankov, S. S., Rouco Escorial, A., Suleimanov, V. F., et al. 2019b, MNRAS, 483, L144 [NASA ADS] [CrossRef] [Google Scholar]
- Tsygankov, S. S., Doroshenko, V., Mushtukov, A. A., et al. 2020, A&A, 637, A33 [NASA ADS] [CrossRef] [EDP Sciences] [Google Scholar]
- Vasilopoulos, G., Petropoulou, M., Koliopanos, F., et al. 2019, MNRAS, 488, 5225 [Google Scholar]
- Yang, J., Zezas, A., Coe, M. J., et al. 2018, MNRAS, 479, L1 [CrossRef] [Google Scholar]
All Tables
All Figures
|
Fig. 1 Joint ART-XC + eROSITA spectrum of SXP 1323. Black points correspond to the eROSITA data, and red points show ART-XC measurements. Spectra from seven ART-XC modules were grouped together and rebinned for clarity. Gray points show the XMM-Newton source spectrum obtained in 2010, when no pulsations were detected. |
| In the text | |
|
Fig. 2 Long-term period evolution of SXP 1323. Circles show XMM-Newton measurements, and the triangle denotes ART-XC data. The dash-dotted line shows the best-fit approximation with a spin-up of −29.9 s yr−1. |
| In the text | |
|
Fig. 3 Pulse profile and pulsed fraction in different energy bands. Left panel: profile in the 1–4 keV (blue) and 4–8 keV (green) band as seen by eROSITA. Middle panel: profile in the 4–8 keV (black) and 8–16 keV (red) band as observed by ART-XC. Right panel: pulsed fraction PFA, calculated as in Eq. (1). |
| In the text | |
Current usage metrics show cumulative count of Article Views (full-text article views including HTML views, PDF and ePub downloads, according to the available data) and Abstracts Views on Vision4Press platform.
Data correspond to usage on the plateform after 2015. The current usage metrics is available 48-96 hours after online publication and is updated daily on week days.
Initial download of the metrics may take a while.