Fig. 1
Download original image
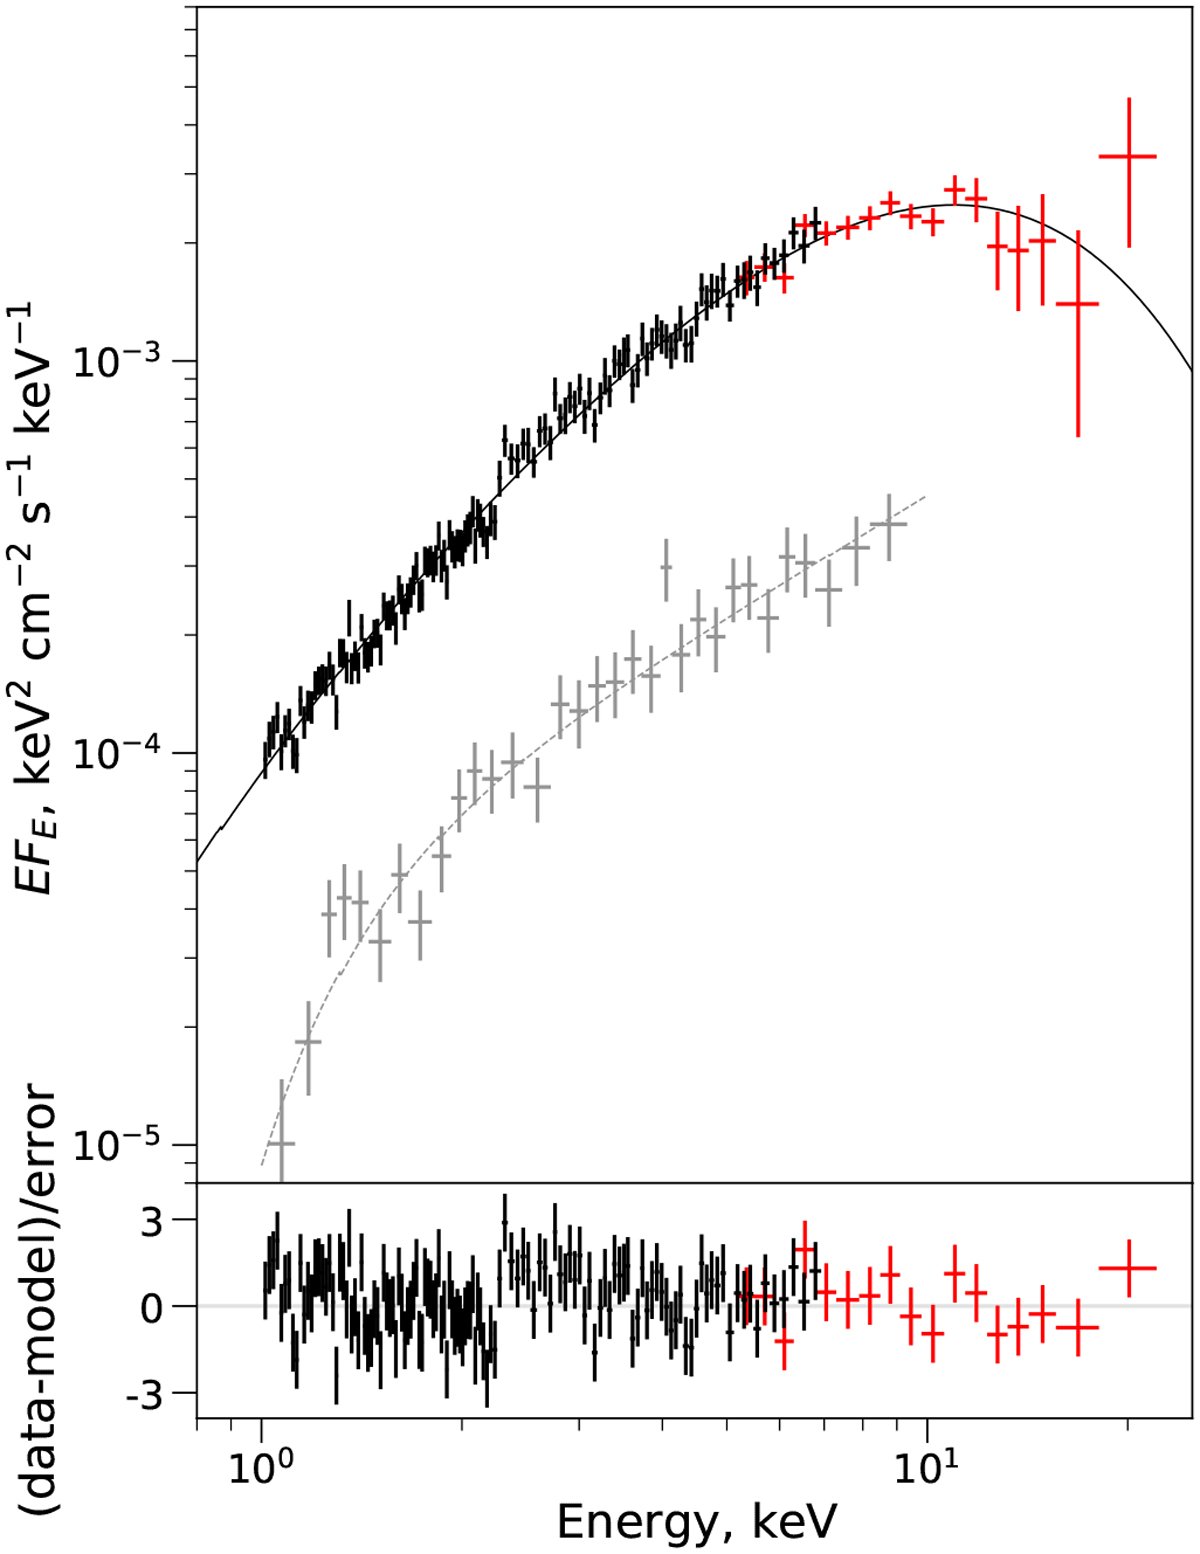
Joint ART-XC + eROSITA spectrum of SXP 1323. Black points correspond to the eROSITA data, and red points show ART-XC measurements. Spectra from seven ART-XC modules were grouped together and rebinned for clarity. Gray points show the XMM-Newton source spectrum obtained in 2010, when no pulsations were detected.
Current usage metrics show cumulative count of Article Views (full-text article views including HTML views, PDF and ePub downloads, according to the available data) and Abstracts Views on Vision4Press platform.
Data correspond to usage on the plateform after 2015. The current usage metrics is available 48-96 hours after online publication and is updated daily on week days.
Initial download of the metrics may take a while.