| Issue |
A&A
Volume 661, May 2022
The Early Data Release of eROSITA and Mikhail Pavlinsky ART-XC on the SRG mission
|
|
|---|---|---|
| Article Number | A28 | |
| Number of page(s) | 9 | |
| Section | Stellar structure and evolution | |
| DOI | https://doi.org/10.1051/0004-6361/202141630 | |
| Published online | 18 May 2022 | |
SRG/ART-XC discovery of SRGA J204318.2+443815: Towards the complete population of faint X-ray pulsars
1
Space Research Institute (IKI) of Russian Academy of Sciences,
Prosoyuznaya ul 84/32,
117997
Moscow, Russian Federation
e-mail: This email address is being protected from spambots. You need JavaScript enabled to view it.
2
Department of Physics and Astronomy, 20014 University of Turku,
Finland
3
Kazan Federal University,
Kremlevskaya Str., 18,
Kazan, Russian Federation
4
Nordic Optical Telescope,
Apartado 474,
38700
Santa Cruz de La Palma, Santa Cruz de Tenerife, Spain
5
Department of Physics and Astronomy, Aarhus University,
NyMunkegade 120,
8000
Aarhus C, Denmark
6
Max Planck Institute for Astrophysics,
Karl-Schwarzschild-Str. 1,
Postfach 1317,
85741
Garching, Germany
7
Division of Physics, Mathematics and Astronomy, California Institute of Technology,
Pasadena, CA 91125, USA
8
School of Physics, University of New South Wales,
Sydney, NSW 2052, Australia
9
Cahill Center for Astrophysics, California Institute of Technology,
Pasadena, CA 91125, USA
Received:
24
June
2021
Accepted:
22
November
2021
Abstract
We report the discovery of the new long-period X-ray pulsar SRGA J204318.2+443815/SRGe J204319.0+443820 in a Be binary system. The source was found in the second all-sky survey by the Mikhail Pavlinsky ART-XC telescope on board the SRG mission. The follow-up observations with XMM-Newton, NICER, and NuSTAR allowed us to discover a strong coherent signal in the source light curve with a period of ~742 s. The pulsed fraction was found to depend on an increase in energy from ~20% in soft X-rays to >50% at high energies, as is typical for X-ray pulsars. The source has a quite hard spectrum with an exponential cutoff at high energies and a bolometric luminosity of LX ≃ 4 × 1035 ergs-1. The X-ray position of the source is found to be consistent with the optical transient ZTF18abjpmzf, located at a distance of ~8.0 kpc. Dedicated optical and infrared observations with the RTT-150, NOT, Keck, and Palomar telescopes revealed a number of emission lines (Ha, He I, and the Paschen and Braket series) with a strongly absorbed continuum. According to the SRG scans and archival XMM-Newton data, the source flux is moderately variable (by a factor of 4-10) on timescales of several months and years. All this suggests that SRGA J204318.2+443815/SRGe J204319.0+443820 is a new quasi-persistent low-luminosity X-ray pulsar in a distant binary system with a Be-star of the B0-B2e class. Thus the SRG observatory allowed us to unveil a hidden population of faint objects, including a population of slowly rotating X-ray pulsars in Be systems.
Key words: stars: neutron / X-rays: binaries / pulsars: individual: SRGAJ204318.2+443815
© ESO 2022
1 Introduction
The key task of the Spectrum Roentgen Gamma (SRG) mission (Sunyaev et al. 2021) is the deepest all-sky survey in X-rays at soft energies 0.3–10 keV with the eROSITA telescope (Predehl et al. 2021) and at hard X-rays 4–30 keV with the Mikhail Pavlinsky ART-XC telescope (Pavlinsky et al. 2021). Surveying about 1% of the sky daily down to fluxes of ≃(1 − 2) × 10−11 erg cm−2 s−1 in the 4–12keV energy band (about 1–1.5 mCrab), the ART-XC telescope is providing a unique possibility of studying the population of faint quasi-persistent or transient X-ray sources that would otherwise be missed because they are too weak for the wide field of view telescopes and all-sky monitors (e.g., RXTE, INTEGRAL/IBIS, Swift/BAT, and MAXI). One of the most intriguing families of these populations are accreting neutron stars with very strong magnetic fields (X-ray pulsars). They allow studying the interaction of matter with the magnetic field at very low-mass accretion rates.
On November 20, 2020, during the second consecutive all-sky survey, the Mikhail Pavlinsky ART-XC telescope discovered the relatively bright X-ray source SRGA J204318.2+443815 with coordinates RA = 310.8259, Dec = 44.6374 (J2000, 90% confidence radius is 25”) and a flux of ~2.4 × 10⁻¹¹ ergs−1 cm−2 in the 4–12 keV energy band (Mereminskiy et al. 2020). This source was also detected by eROSITA under the name SRGeJ204319.0+443820. This detection allowed obtaining a more precise position (RA = 310.8293, Dec = 44.6390, J2000; the 95% confidence radius is 4”) and performing a preliminary spectral analysis in soft X-rays (Mereminskiy et al. 2020). The eROSITA position is found to be consistent with the optical transient ZTF18abjpmzf, which in turn is identified with a distant star at  kpc using the Gaia survey (Bailer-Jones et al. 2021) (see Sect. 6.3 for details). This distance value is used in the following calculations.
The source ZTF18abjpmzf has been monitored by the Zwicky Transient Facility (ZTF; Bellm et al. 2019; Graham et al. 2019) since March 2018. The ZTF detection positions is (RA, Dec) = (310.827745, 44.638897) = (20h43m18.66s, +44d38m20.0s) (J2000)2, which corresponds to the Galactic coordinates (l,b) = (83.9837, 1.3407). The optical source is coincident with a bright infrared star detected in 2MASS (Skrutskie et al. 2006). This star exhibited a variable infrared emission in the J band based on data taken with the Palomar Gattini-IR survey (PGIR; Moore & Kasliwal 2019; De et al. 2020c) since November 2018.
Follow-up optical observations with the robotic Palomar 60-inch telescope as well as an inspection of the archival data of ZTF, WISE, and Palomar Gattini-IR revealed a strong Hα line in the optical spectrum and optical and IR variability (Yao et al. 2020; De et al. 2020b). Based on these measurements as well as the low Galactic latitude of the transient and the strong absorption in its spectrum, we assume that SRGA J204318.2+443815 is a new high-mass X-ray binary (HMXB) system, harbouring a neutron star and a Be companion.
In this paper, we report the discovery of the new transient SRGAJ204318.2+443815 and results of its follow-up observations in X-rays with XMM-Newton, NuSTAR, Swift/XRT, and NICER and optics with the RTT-150, NOT, Keck, and Palo-mar telescopes. These observations allow discovering coherent pulsations with a period of ~742 s in the source light curve, measuring its broadband spectrum, and revealing the Be nature of the optical counterpart.
2 Observations and data analysis
2.1 X-ray observations
During the second SRG survey, SRGA J204318.2+443815 was observed by the Mikhail Pavlinsky ART-XC telescope with a total exposure of 125 s (an effective exposure time of ~37 s). Taking the faintness of the source, the short exposure, and the limited number of photons into account, we attributed all counts detected by ART-XC to two broad energy bins (4–12 an 12–26 keV) and modelled the ART-XC data jointly with the contemporary eROSITA spectrum. ART-XC data were processed with the analysis software artproducts v0.9 with caldb version 20200401. eROSITA detected the source SRGeJ204319.0+443820 in both surveys: at the moment of its discovery with ART-XC in eRASS2 (November 18–21, 2020) with a total exposure of 252s, and (based on the retrospective analysis) in eRASS1 (May 18-22, 2020), where it was observed with a total exposure of 289 s. eROSITA data were processed with the eROSITA pipeline at IKI based on eSASS package components and data analysis software developed at IKI. SRGA J204318.2+443815/SRGe J204319.0+443820 was also significantly detected by ART-XC and eROSITA during the third survey on May 21,2021, with total exposures of 138 and 227 s, respectively.
Soon after the detection of the source, we initiated NICER follow-up observations in order to examine its short-scale variability. For different reasons (limited visibility and temporal problems with the power supply at ISS), no observations were carried out until December 4, 2020, when the first short (900 s) observation was performed. Later, a longer observation was carried out on December 11, 2020. This observation lasted for 8 ks. We used the standard NICERDAS in order to extract spectra and light curves. unfortunately, the source was too obscured and weak; energies box ≈2keV and box ≈5keV were dominated by a non-photon background. Therefore we decided to not use spectral data. In the 2–6 keV energy band, we found a significant modulation with a period of 741.8 s. Its shape is roughly consistent with XMM-Newton measurements.
To further improve the source localisation and to study its spectral an timing properties in soft X-rays in detail, we asked for follow-up DDT observations of SRGA J204318.2+443815 with the XMM-Newton observatory. Observations were performed on December 9, 2020 (ObsID 0872391201). To process the XMM-Newton data, we used the XMM-Newton Science Analysis System (SAS) version 18.0. For the analysis of the EPIC data, we selected events with patterns in the range 0–4 for the pn camera and 0–12 for the two MOS cameras, using a circular region with a radius of 20” around the source position. Background events were selected from circular regions (with a radius of 30”) offset from the source position.
To trace the long-term variability of the source, observations with the X-ray telescope (XRT; Burrows et al. 2005) on board the Neil Gehrels Swift Observatory (Gehrels et al. 2004) were triggered. This monitoring lasted for three months from November 24, 2020, to February 22, 2021. All XRT data were taken in the photon-counting mode and were reduced using the online tools2 (Evans et al. 2009) provided by the uK Swift Science Data Centre. The resulting spectra were fitted with a simple absorbed power-law model in the 0.3–10 keV band using the XSPEC package (Arnaud 1996).
Finally, in our analysis we used the NuSTAR data to confirm a detection of pulsations, which were initially found in the XMM-Newton and NICER data, and also to study the proprties of the source in the broad X-ray band. The NuSTAR observatory consists of two identical X-ray telescope modules, referred to as FPMA and FPMB (Harrison et al. 2013). It provides X-ray imaging, spectroscopy, and timing capabilities in the energy range of 3–79 keV. NuSTAR performed an observation of SRGA J204318.2+443815 on December 22,2020 (ObsID 90601338002). The data reduction for this observation was made using HEASOFT v6.28 and CalDB version 20210210.
All spectra were binned to have at least one count per energy bin. W-statistic3 was applied (Wachter et al. 1979).
2.2 Optical and infrared data
RTT-150
Optical observations from the Russian-Turkish Telescope (RTT-150) have been performed by using the TFOSC instrument on November 24-25, 2020, and April 9, 2021 (low-resolution spectrometer and imager). We used g, r, i, z filters for photometrical observations. During the RTT-150 observations, the optical counterpart was brighter by 0.3–0.5 mag than SDSS DR16 archive data, showing long-term variations its brightness between November 2020 and April 2021. At the same time, we found no fast variations in brightness on a timescale of 3 hours during RTT-150 photometrical observations on November 24, 2020, when we obtained two low-resolution (15 Angstrom) spectra with an exposure of 900s each.
NOT
At the 2.56 m Nordic Optical Telescope, we applied for time through the fast-track access and obtained an optical low-resolution spectrum on March 18, 2021, with ALFOSC and near-IR low-resolution spectra on April 25,2021, with NOTCam.
The ALFOSC spectrum with Grism 4 and a 1” wide slit covers the wavelength range 3200–9600 Å with a resolving power of R = 360. The exposure time was 2700 s. The near-IR spectra were obtained with NOTCam Grism 1 and the broad-band filters J and K as order sorters. The dispersions are 2.5 and 4.1 Åpix−1 in / and K, respectively, and together with the 0.6” wide slit, give a resolving power of R = 2100. Six spectra were taken by dithering the target along the slit with individual exposure times of 300 s using ramp-sampling readout modes. Each sky-subtracted and flat-fielded spectrum was optimally extracted and wavelength calibrated before it was combined to a final spectrum. A nearby bright star of spectral type A0 V was observed immediately before the target and was used for telluric correction, removing primarily the stellar absorption lines, upon which a properly flux-scaled Vega model was multiplied back to restore the slope and obtain a rough flux calibration. For the J band, we used the telluric standard to find the conversion from ADU/s to fλ, while for the K band, we used the target acquisition image with comparison stars.
Keck, Palomar
We obtained follow-up optical and near-IR spectra using the Low Resolution (R ≈ 1000) Imaging Spectrograph (LRIS/Keck-I; Oke et al. 1995) on December 12, 2020, the medium-resolution (R ≈ 13000) Echellette Spectrograph and Imager (ESI/Keck-ii; Sheinis et al. 2002) on December 08, 2020, and the medium-resolution (R = 2700) Triplespec spectrograph (Tspec/Palomar 200-inch telescope; Herter et al. 2008) on December 23, 2020.
3 Source discovery and long-term variability
The long-term X-ray light curve covering about three months of observations of SRGA J204318.2+443815 with the Swift/XRΥ telescope after its discovery is presented in Fig. 1. The figure shows that no significant source variability was revealed on this timescale nor during the 6 months after discovery, when the two SRG instruments again detected SRGA J204318.2+443815 in May 2021 at approximately the same level of intensity. At the same time, the X-ray source exhibited a moderate variability between the first and the second SRG all-sky surveys separated by six months.
Additionally, an inspection of previous scans of this sky field during the XMM-Newton slew surveys4 (Saxton et al. 2008) (in June 2010, December 2011, December 2018, and April 2020) showed no detection of the source with the lowest flux limit of 2.2 × 10⁻¹² erg s−1 cm−2 in the 0.2–12 keV energy band in 2011 (dotted red line in Fig. 1). This limit indicates the source flux variability at least at an order-of-magnitude level.
As mentioned box, SRGA J204318.2+443815 was initially discovered in the near-real time analysis of the ART-XC and eROSITA data during the second all-sky survey. The retrospective detailed analysis of the data from both instruments obtained during the first survey showed that the source was registered by eROSITA, but remained box the detection threshold in the ART-XC data. The spectra of SRGA J204318.2+443815 measured by eROSITA + ART-XC and eROSITA in the first and second surveys, respectively, are shown in Fig. 2. They are quite similar and can be describe by an absorbed power law. The absorption values NH = (3.0 ± 0.8) × 1022 and NH = (4.5 ± 0.8) × 1022 cm−2, measured in the first and second survey, respectively, are compatible with each other and exceed the Galactic value in the source direction. This might indicate a possible presence of intrinsic absorption in the system, similar to what was found in a number of faint BeXRB systems. At the same time, the fit model we used and the real spectral shape might look quite different, which would give rise to systematic uncertainties in the obtained fit parameters (e.g. NH). The source flux in the 0.5–10 keV band obtained during the second survey (2.2 ± 0.4) × 10−11 ergs−1 cm−2 increased by factor of ≃3.7 in comparison to the source flux in the first survey,  × 10−12 erg s−1 cm−2. It was accompanied by a hardening of the spectral index from 1.9 ± 0.7 to 0.95 ± 0.30, which allowed us to register the source with the ART-XC telescope (Fig. 2).
The optical counterpart of SRGA J204318.2+443815 ZTF18abjpmzf has been monitored by optical surveys, including the Sloan Digital Sky Survey (SDSS, Alam et al. 2015) DR12, the Panoramic Survey Telescope and Rapid Response System (Pan-STARRS, PS1) DR1 (Flewelling et al. 2020; Waters et al. 2020), and the ZTF DR5. We obtained forced photometry on ZTF difference images using a publicly available tool5 (Masci et al. 2019). For each band, we computed the sum of the flux density in the reference image and difference images. The full optical light curve of ZTF18abjpmzf is shown in the bottom panel of Fig. 1.
The optical photometry from the ZTF survey allows searching for the possible orbital period in the system. From a measured equivalent width (EW) of the Hα line EW(Hα) = −17.40 ± 0.07 Å (see Sect. 6.2) using the relation between EW and the orbital period for BeXRBs (see e.g. Reig 2011), we expect the orbital period to be about 50 days. Otherwise, from the Corbet diagram and known spin period, the SRGA J204318.2+443815 orbital period is estimated to be ≈200 days.
Similarly, we performed forced photometry of PGIR20fah, which is the near-IR counterpart of ZTF18abjpmzf, using the PGIR images based on the method described in De et al. (2020a). The J-band light curve is shown in Fig. 1.
To search for the source orbital period, we calculated a generalised Lomb-Scargle periodogram (Scargle 1982) from all available ZTF r-filter measurements. We also produced 100 simulated data sets with a similar level of red noise at higher frequencies. No significant peaks are observed in the periodogram. A similar analysis was carried out for PGIR data. No prominent peaks were found.
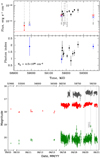 |
Fig. 1 Long-term variability of SRGA J204318.2+443815 in different wavebands. Upper, light curve of SRGA J204318.2+443815 obtained with Swift/XRT (black points) and eROSITA (blue crosses) in the 0.5–l0keV energy band and with ART-XC (red crosses) in the 4–12 keV energy band. The times of the source observations with other X-ray instruments are shown with vertical grey lines: SRG (long dash-dotted line), NICER (dashed line), XMM-Newton (dash-dotted line), and NuS-TAR (long dashed line). The source fluxes measured by ART-XC and eROSITA during the discovery and in the first and third surveys are shown with the red asterisk and blue crosses, respectively. The upper limits for the source flux from the XMM-Newton slew surveys in April 2020 and December 2011 are shown by the red circle and red dotted line, respectively. Middle: dependence of the photon index assuming a simple absorbed power-law spectral model with NH fixed at the value of 4.5 × 1022 cm−2, determined from the average spectrum. Bottom: long-term optical light curve of ZTF18abjpmzf in g (r) filters shown in green (red). Earliest measurements (dots) are from the SDSS, PanSTARRS data are shown with pluses, and ZTF data are shown with crosses. J-Alter measurements from PGIR (shifted for clarity by +4 magnitudes) are shown with black dots. A secular long-term brightening is clearly seen in r-filter measurements, along with the irregular short-scale low-amplitude variability. |
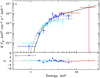 |
Fig. 2 Spectra of SRGA J204318.2+443815 measured with SRG instruments. Blue and red points correspond to eROSITA and ART-XC observations in the second survey, respectively. Cyan points represent the spectrum obtained by eROSITA during the first survey. Solid and dashed lines are the corresponding best-fit models. |
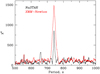 |
Fig. 3 Periodogram of the source, obtained by NuSTAR (black) and XMM-Newton (red). A coherent signal is clearly detected by both instruments around ≃742 s. |
4 Timing analysis and discovery of pulsations
Soon after the discovery of SRGA J204318.2+443815 with ART-XC, we triggered a TOO observation with the XMM-Newton observatory in order to study its properties in detail. The observation was performed about three weeks after the discovery. Figure 1 shows that the source was found in the same intensity state. For the timing analysis, we firstly applied the barycentric correction (the barycen tool in the SAS package). Using a standard epoch-folding technique (the efsearch tool in the HEASOFT package), we were able to discover very strong pulsations of the flux with a period of Ps = 741.4 ± 0.3 s (see Fig. 3). About 2 weeks after the XMM-Newton observation, SRGAJ204318.2+443815 was observed with NuSTAR. Using these data, we were able to confirm pulsations in the source light curve with a period of Ps = 741.8 ± 0.1 s. Both values show that the source does not spin-up or spin-down strongly, which is compatible with the stability of its flux. Uncertainties for the pulse period values were determined from the simulated light curves following the procedure described by Boldin et al. (2013).
Using the corresponding spin periods, we constructed the pulse profile of SRGA J204318.2+443815 in different energy bands (Fig. 4). The pulse profile clearly depends on the energy. At low energies (box several keV), it has a simple single-peak structure, while the multiple peaks become more prominent with the increase in energy. In particular, the profile in the 10–20 keV energy band consists of four peaks that are evenly distributed over the spin phases and have a comparable intensity. At even higher energies, the pulse profile is dominated by two main peaks at phases of about 0.1 and 0.8.
The broad energy band coverage provided with XMM-Newton and NuSTAR allowed us also to study the dependence of the pulsed fraction6 on the energy. It increases with energy (Fig. 5), which is typical for most XRPs (see e.g. Lutovinov & Tsygankov 2009). Moreover, the increase rate changes at about 10–5 keV, which may indicate that different physical mechanisms cause the observed emission in different energy bands. Alternatively, some scattering medium might affect low-energy photons.
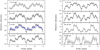 |
Fig. 4 Pulse profiles of SRGA J204318.2+443815 as a function of the energy as observed by XMM-Newton (left) and NuSTAR (right). The blue profile represents results obtained from the NICER data in the 2–6 keV band. Zero-phase in both datasets is chosen arbitrarily to coincide with the main minimum in the profile. |
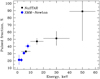 |
Fig. 5 Pulsed fraction of SRGA J204318.2+443815 as a function of the energy as observed by XMM-Newton (blue circles) and NuSTAR (black squares). |
5 Broad-band X-ray spectrum
As follows from the Swift/XRT monitoring and SRG observations, the source flux and spectral parameters evolve only slightly. Therefore we can approximate the spectra obtained by XMM-Newton, NuSTAR, and Swift/XRT simultaneously.
As is well known, broad-band spectra of X-ray pulsars differ significantly from the spectra of neutron stars with a low magnetic field in low-mass X-ray binaries and from the spectra of accreting black holes (Syunyaev et al. 1991). The broad-band spectrum of SRGA J204318.2+443815 is typical for accreting magnetised neuron stars and shows an exponential cut-off at high energies (Fig. 6). Therefore, we fitted it with several continuum models that are commonly used for such objects: a power law with a high-energy exponential cut-off (highcut or cutoffpl in the XSPEC package), a combination of negative and positive power laws with an exponential cut-off and the Comptoniza-tion model COMPPTT (Titarchuk 1994). Additional components accounting for the interstellar absorption and fluorescent iron line at 6.4 keV were added, such as the PHABS model and a Gaussian.
The source and background spectra from all three cameras of XMM-Newton (MOS1, MOS2, and PN) and the two FPMA and FPMB modules of NuSTAR and of the Swift/XRT telescope were used for simultaneous fitting. To take the uncertainty in the instrument calibrations as well as the lack of full simultaneity of observations into account, cross-calibration constants between them were included in the spectral model.
All these models describe the source spectrum quite adequately, but the compTT model gives the better fit quality (χ2 = 1385 (1279 d.o.f.) for CUYOFFPL, 1353 (1278 d.o.f.) for POWERLAW*HIGHCUT, 1326 (1278 d.o.f.) for COMPTT). The best-fit parameters are summarised in Table 1.
No obvious absorption features are connected with cyclotron resonant scattering features in the energy range of 5–50 keV. This allowed us to roughly constrain the magnetic field strength of the neutron star as B<5×l011 or B>5×l012G (see Tsygankov & Lutovinov 2005, for a brief description of the technique).
The conclusion that additional spectral features are lacking was also verified using phase-resolved spectroscopy, as there are pulsars in which the cyclotron line or its higher harmonics appear only in certain phases of the rotation of the neutron star (see e.g. Molkov et al. 2019, 2021). In particular, we produced energy spectra of the source in ten evenly distributed phase bins. Unfortunately, the low counting statistics prevented us from detecting significant variations over the pulse of any spectral parameters of our best-fit model.
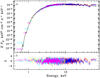 |
Fig. 6 (a) Energy spectrum of SRGA J204318.2+443815 as measured by Swift/XRT (green points), XMM-Newton (yellow, cyan, and magenta points for PN, MOS1, and MOS2 instruments, respectively) and NuSTAR (blue and red points for the FPMA and FPMB modules, respectively). The black line corresponds to the best-fit model COMPTT+GAUSS+PHABS. (b) Residuals from the model. |
Best-fitting results for the spectrum of SRGAJ204318.2+443815.
6 Optical observations
6.1 Optical and infrared (OIR) photometry
ZTFl8abjpmzf has been observed by the Two Micron All-Sky Survey (2MASS; Skrutskie et al. 2006), the Wide-field Infrared Survey Explorer (WISE) telescope (Wright et al. 2010), and the Palomar Gattini-IR (De et al. 2020c). In the A11WISE catalogue (Circa 2010, Cutri & et al. 2013), the source was detected at W1 = 10.868 ± 0.023, W2 = 10.724 ± 0.021, W3 = 10.326 ± 0.107, and W4 = 8.905 ± 0.410 (Vega system). During the post-cryogenic phase from 2014 to 2020, it was also monitored by the Near-Earth Object WISE Reactivation Mission (NEOWISE; Mainzer et al. 2014) every six months in the Wl and W2 bands. The infrared light curves are presented in Fig. 7.
As reported by Yao et al. (2020) and De et al. (2020b), ZTFl8abjpmzf exhibits a secular brightening and undulations on timescales of years in the optical and infrared bands. From 2010 to 2020, the source has clearly brightened by ∆g ≈ 0.10, Δr ≈ 0.65, ∆Wl ≈ 0.82, and ∆W2 ≈ 0.98. ZTFl8abjpmzf also exhibits transient fluctuations at the level of 0.1–0.2 mag on a timescale of a few days. These results are also confirmed by RTT-150, revealing long-term variations of the object brightness on a timescale of several months (see below). The PGIR J-band light curve exhibits long-term low-amplitude variability from the source, in addition to a secular brightening of ≈0.2 mag between November 2019 and May 2020.
Long-term secular variations in brightness and optical to near-IR colors in BeXRBs are often associated with the disk-loss episodes (see e.g. Wisniewski et al. 2010, and references therein). During these episodes, the optical source becomes fainter and bluer (Reig & Fabregat 2015), while during disk recovery, the source is brighter and redder. This is closely reminiscent of the observed brightness evolution of SRGAJ204318.2+443815 and also agrees well with the non-detection of the source in 2011 by XMM-Newton.
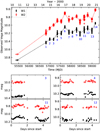 |
Fig. 7 WISE light curve of ZTF18abjpmzf in the Wl and W2 bands. The lower panels show the zoom of four NEOWISE visits. |
6.2 Optical and near-infrared spectroscopy
The optical spectrum of ZTFl8abjpmzf obtained with RTT-150 on November 24, 2020, in frames of the follow-up campaign exhibited a highly reddened featureless continuum with the Hα line alone in emission. Two additional RTT-150 spectra with a higher resolution of ~5.5Å measured on November 25, 2020, with an exposure of 3600 s each allowed us to measure the full width at half maximum of the Hα line as ≃13 Å and the equivalent width, EW ≃14Å. Taking into account the instrumental profile, the intrinsic width of the Hα line can be estimated as ≃12Å (550kms−1). This value corresponds to Vsin ≃ 275 km s−1, which agrees with the rotational speed of the equatorial disk around a Be star.
Later, in the LRIS and Tspec spectra (Fig. 8), we identify strong emission lines of He I, He I, and Feii. We also see strong interstellar absorption lines such as Na I and K I and diffuse interstellar bands (DIBs). These indicate a stellar spectrum of Be type (Gray & Corbally 2009). There is very little flux box 5000 Å due to the high extinction, preventing us from assigning an accurate spectral type. However, the strong emission in the H I Paschen series (Pa7 to Pa 19) identifies the star as no later than B2 (Andrillat et al. 1988). In the near-IR, we observed the H I Brackett series (Br7 and Br 10 to Br24), as well as He I at 1.083 μm, 1.700 μm, and 2.058 μm. These emission lines signify a star earlier than B2.5 (Hanson et al. 1996). The non-detection of He I at 2.1116 μm and singly ionised helium is indicative of stars later than 09 (Hanson et al. 1998, 2005). The Hα profile (inset, upper panel of Fig. 8) shows a shallow absorption core on top of an emission line with a kinematically broadened full width at half maximum of 460 km s−1. This value is slightly lower than the values estimated from RTT-150, but it is still compatible with typical rotational speeds of the decretion disks around Be stars and signifies a viewing angle that is not close to edge-on (Hanuschik 1996). Taken together, we conclude that ZTFl8abjpmzf contains a star of spectral type B0-B2e.
We produced a summed spectrum using LRIS and ESI data and measured the equivalent width of interstellar absorption lines. Using the relations reported by Munari & Zwitter (1997) and Yuan & Liu (2012), the measured EW(K I λ7699) = 0.47 ± 0.01, EW(DIB λ5780) = 1.73 ± 0.06, and EW(DIB λ6283) = 3.67 ± 0.04 can be converted into E(B − V) = 2.07 ± 0.03, 2.84 ± 0.10, and 2.91 ± 0.03, respectively. We note that the highly reddened nature of ZTFl8abjpmzf requires extrapolation of the nominal relations beyond the calibrated ranges. Therefore, the derived E(B − V) = 2−3 should be considered as rough estimates.
The NOTCam near-IR spectra taken on April 25, 2021 (Fig. 9), shows strong emission lines in Pa β, Br γ, and He I at 2.058 μm, the latter quite broad. The continuum flux is lower than that observed with Tspec four months earlier. The emission lines, conversely, are stronger: the Pa β EW is −6.9 ± 0.5 Å and the Br γ EW is −5.3 ± 0.5 Å in the NOTCam spectra, which is about twice the value measured four months earlier by Tspec. From the K-band acquisition image, we used differential photometry with nine comparison stars to approximately calibrate the flux. We found that the target was 0.89 ± 0.08 mag brighter than its catalogued 2MASS magnitude.
Using the derived constraints on the stellar class of the optical star, we can compare the observed magnitudes of the IR counterpart from the 2MASS catalogue7 (H = 11.904 ± 0.021; Ks = 11.481 ± 0.018) with the absolute magnitudes of B0-2e stars. According to Wegner (2015), the average intrinsic colour of these stars is (H − Ks)0 ≃ −0.04. Thus, under the assumption of the standard extinction law (Cardelli et al. 1989), we can estimate the magnitude of the absorption AKs towards the source as AH – AKs = (H – Ks) – (H – Ks)0, which gives AKs ≃ 0.85 and E(B – V) ≃ 2.5.
Correcting the observed magnitude of the counterpart in the Ks filter for the absorption and comparing unabsorbed magnitude with the absolute one, we can estimate (see Karasev et al. 2015, for details) the distance to the object in the range of 4–7.5 kpc, which approximately agrees with the values obtained by Bailer-Jones et al. (2021).
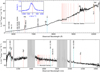 |
Fig. 8 Optical and infrared spectra of SRGA J204318.2+443815/ZTF18abjpmzf. Upper, observed LRIS spectrum of ZTF18abjpmzf. The inset shows the Hα profile in the ESI spectrum, where the instrumental broadening is σinst = l6kms−1. Bottom: observed Tspec spectrum of ZTF18abjpmzf. Wavelength ranges of high atmospheric opacity are masked in grey. |
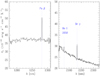 |
Fig. 9 Parts of the J and K band spectra with the prominent emission lines obtained with NOTCam on April 25, 2021. |
6.3 Proper motion
In the Gaia Early Data Release 3 (EDR3) catalogue (Lindegren et al. 2021), the parallax of ZTF18abjpmzf was measured with a quite large uncertainty  . Nevertheless, Bailer-Jones et al. (2021) estimated the geometric distance to the source as
  kpc, inferring the distance with a direction-dependent prior of our Galaxy.
The proper motions in EDR3 are detected at high significance: μα,* = μαcosδ = −2.61 ± 0.07 mas yr−1, and μδ = −4.23 ± 0.07 mas yr−1. This can be transferred into the Galactic coordinate system, which gives μl,* = μlcosb = −4.94 ± 0.07 mas yr−1, and μb = −0.56 ± 0.07 mas yr−1. Assuming a flat Galactic rotation curve of vrot(r) = 220 km s−1 (Honma & Sofue 1997) and the galactocentric distance of the Sun, r0 = 8.1 kpc (Bovy et al. 2012), we expect the rotation-induced proper motion to be  mas yr−1 for sources in the Galactic plane. Since
  is close to the observed μl,*, we conclude that ZTF18abjpmzf does not exhibit an intrinsically high proper motion.
7 Conclusions
We reported the discovery of the new X-ray pulsar SRGAJ204318.2+443815/SRGeJ204319.0+443820. The source was found by the two instruments ART-XC and eROSITA on board SRG during the second and third all-sky surveys. The follow-up campaign with X-ray and optical observatories allowed us to reveal pulsations with a period of ≃742 s, a hard X-ray spectrum with an exponential cut-off and a number of emission lines (Hα, He I, and the Paschen and Braket series) in the optical and infrared spectra of the companion star. These two factors and the source luminosity of LX ≃ − 4 × 1035 erg s−1, estimated from the X-ray spectrum of the source (Table 1) and Gaia distance ≃8 kpc, strongly suggest a BeXRB nature of SRGAJ204318.2+443815. Moreover, based on the optical and IR spectral measurements, we can restrict the spectral type of the companion star as B0-B2e at an estimated distance of 4–7.5 kpc, which approximately agrees with the Gaia measurements.
Based on the relative stability of the source flux on a timescale of several months, this apparently is a new member of the subclass of quasi-persistent low-luminosity BeXRB systems (see e.g. Reig 2011) that presumably accretes from the cold accretion disk (Tsygankov et al. 2017a,b). Historical XMM-Newton data indicate possible variability of the X-ray flux caused by an evolution of the optical companion, which is also seen from the long-term monitoring in optical and near-IR bands. This joint optical and X-ray variability could be naturally explained in terms of a decretion disk loss episode, during which the source was quiescent in X-rays and dimmer in the optical and near-IR bands. Later, the replenishment of disk around the optical star restarted the accretion onto the neutron star, leading to the increase in X-ray flux, and eventually, to the ART-XC detection. The classical persistent X-ray pulsar in the Be system X Persei also shows a flux variability with a factor of five or even more on a timescale of several months to years (see e.g. Lutovinov et al. 2012).
The relatively hard X-ray band of the ART-XC telescope also makes the measured X-ray flux less dependent on the source intrinsic or Galactic absorption and allows the detection of heavily absorbed sources that might be missed by soft X-ray instruments. Taking into account that the sensitivity of the SRG telescopes exceeds any previous and currently working surveying instruments, the SRG observatory allowed us to unveil a hidden population of faint transients or quasi-persistent objects, including a population of slowly rotating X-ray pulsars in super-giant and BeXRB systems (see e.g. Chernyakova et al. 2005; Lutovinov et al. 2005; Bodaghee et al. 2006, 2012; Sidoli et al. 2012). The potential of SRG to reach this goal is demonstrated by this paper and by the discovery of several other new XRPs in the Magellanic Clouds and our Galaxy (see e.g. Haberl et al. 2020; Maitra et al. 2020; Doroshenko et al. 2022).
Acknowledgements.
This work is based on observations with the Mikhail Pavlinsky ART-XC, and eROSITA X-ray telescopes aboard the SRG observatory. The SRG observatory was built by Roskosmos in the interests of the Russian Academy of Sciences represented by its Space Research Institute (IKI) in the framework of the Russian Federal Space Program, with the participation of the Deutsches Zentrum für Luft- und Raumfahrt (DLR). The ART-XC team thanks the Russian Space Agency, Russian Academy of Sciences and State Corporation Rosatom for the support of the ART-XC telescope design and development. The SRG/eROSITA X-ray telescope was built by a consortium of German Institutes led by MPE, and supported by DLR. The SRG spacecraft was designed, built, launched and is operated by the Lavochkin Association and its subcontractors. The science data are downlinked via the Deep Space Network Antennae in Bear Lakes, Ussurijsk, and Baykonur, funded by Roskosmos. The eROSITA data used in this work were processed using the eSASS software system developed by the German eROSITA consortium and proprietary data reduction and analysis software developed by the Russian eROSITA Consortium. We also would like to thank the XMM-Newton, NuSTAR, NICER and Swift/XRT teams for organising prompt observations. This research has made use of data, software and/or web tools obtained from the High Energy Astrophysics Science Archive Research Center (HEASARC), a service of the Astrophysics Science Division at NASA/GSFC and of the Smithsonian Astrophysical Observatory’s High Energy Astrophysics Division. This work made use of data supplied by the UK Swift Science Data Centre at the University of Leicester. Authors (IFB, MRG, RAS) are grateful to TUBITAK, the Space Research Institute, the Kazan Federal University for their partial support in using RTT-150 (the Russian-Turkish 1.5-m telescope in Antalya). The work is partly based on observations made with the Nordic Optical Telescope, owned in collaboration by the University of Turku and Aarhus University, and operated jointly by Aarhus University, the University of Turku and the University of Oslo, representing Denmark, Finland and Norway, the University of Iceland and Stockholm University at the Observatorio del Roque de los Muchachos, La Palma, Spain, of the Instituto de Astrofisica de Canarias. This work was supported by the Russian Science Foundation (grant 19-12-00423).
References
- Alam, S., Albareti, F. D., Allende Prieto, C., et al. 2015, ApJS, 219, 12 [Google Scholar]
- Andrillat, Y., Jaschek, M., & Jaschek, C. 1988, A&AS, 72, 129 [NASA ADS] [Google Scholar]
- Arnaud, K. A. 1996, in ASP Conf. Ser., 101, Astronomical Data Analysis Software and Systems V, eds. G.H. Jacoby, & J. Barnes (San Francisco: Astron. Soc. Pac.), 17 [Google Scholar]
- Bailer-Jones, C. A. L., Rybizki, J., Fouesneau, M., Demleitner, M., & Andrae, R. 2021, AJ, 161, 147 [Google Scholar]
- Bellm, E. C., Kulkarni, S. R., Graham, M. J., et al. 2019, PASP, 131, 018002 [Google Scholar]
- Bodaghee, A., Walter, R., Zurita Heras, J. A., et al. 2006, A&A, 447, 1027 [NASA ADS] [CrossRef] [EDP Sciences] [Google Scholar]
- Bodaghee, A., Rahoui, F., Tomsick, J. A., & Rodriguez, J. 2012, ApJ, 751, 113 [NASA ADS] [CrossRef] [Google Scholar]
- Boldin, P. A., Tsygankov, S. S., & Lutovinov, A. A. 2013, Astron. Lett., 39, 375 [NASA ADS] [CrossRef] [Google Scholar]
- Bovy, J., Allende Prieto, C., Beers, T. C., et al. 2012, ApJ, 759, 131 [NASA ADS] [CrossRef] [Google Scholar]
- Burrows, D. N., Hill, J. E., Nousek, J. A., et al. 2005, Space Sci. Rev., 120, 165 [Google Scholar]
- Cardelli, J. A., Clayton, G. C., & Mathis, J. S. 1989, ApJ, 345, 245 [Google Scholar]
- Chernyakova, M., Lutovinov, A., Rodriguez, J., & Revnivtsev, M. 2005, MNRAS, 364, 455 [NASA ADS] [CrossRef] [Google Scholar]
- Cutri, R. M., et al. 2013, VizieR Online Data Catalog: II/328 [Google Scholar]
- De, K., Ashley, M. C. B., Andreoni, I., et al. 2020a, ApJ, 901, L7 [NASA ADS] [CrossRef] [Google Scholar]
- De, K., Hankins, M., Kasliwal, M. M., et al. 2020b, ATel, 14234, 1 [NASA ADS] [Google Scholar]
- De, K., Hankins, M. J., Kasliwal, M. M., et al. 2020c, PASP, 132, 025001 [NASA ADS] [CrossRef] [Google Scholar]
- Doroshenko, V., Staubert, R., Maitra, C., et al. 2022, A&A, 661, A21 (eROSITA EDR SI) [NASA ADS] [CrossRef] [EDP Sciences] [Google Scholar]
- Evans, P. A., Beardmore, A. P., Page, K. L., et al. 2009, MNRAS, 397, 1177 [Google Scholar]
- Flewelling, H. A., Magnier, E. A., Chambers, K. C., et al. 2020, ApJS, 251, 7 [NASA ADS] [CrossRef] [Google Scholar]
- Gehrels, N., Chincarini, G., Giommi, P., et al. 2004, ApJ, 611, 1005 [Google Scholar]
- Graham, M. J., Kulkarni, S. R., Bellm, E. C., et al. 2019, PASP, 131, 078001 [Google Scholar]
- Gray, R. O., & Corbally, Christopher, J. 2009, Stellar Spectral Classification [Google Scholar]
- Haberl, F., Maitra, C., Carpano, S., et al. 2020, ATel, 13609, 1 [Google Scholar]
- Hanson, M. M., Conti, P. S., & Rieke, M. J. 1996, ApJS, 107, 281 [NASA ADS] [CrossRef] [Google Scholar]
- Hanson, M. M., Rieke, G. H., & Luhman, K. L. 1998, AJ, 116, 1915 [NASA ADS] [CrossRef] [Google Scholar]
- Hanson, M. M., Kudritzki, R. P., Kenworthy, M. A., Puls, J., & Tokunaga, A. T. 2005, ApJS, 161, 154 [NASA ADS] [CrossRef] [Google Scholar]
- Hanuschik, R. W. 1996, A&A, 308, 170 [NASA ADS] [Google Scholar]
- Harrison, F. A., Craig, W. W., Christensen, F. E., et al. 2013, ApJ, 770, 103 [Google Scholar]
- Herter, T.L., Henderson, C.P., Wilson, J.C., et al. 2008, in Society of Photo- Optical Instrumentation Engineers (SPIE) Conference Series, 7014, Groundbased and Airborne Instrumentation for Astronomy II, eds. I.S. McLean, & M.M. Casali, 70140X [Google Scholar]
- Honma, M., & Sofue, Y. 1997, PASJ, 49, 453 [CrossRef] [Google Scholar]
- Karasev, D. I., Tsygankov, S. S., & Lutovinov, A. A. 2015, Astron. Lett., 41, 394 [NASA ADS] [CrossRef] [Google Scholar]
- Lindegren, L., Klioner, S. A., Hernandez, J., et al. 2021, A&A, 649, A2 [NASA ADS] [CrossRef] [EDP Sciences] [Google Scholar]
- Lutovinov, A. A., & Tsygankov, S. S. 2009, Astron. Lett., 35, 433 [NASA ADS] [CrossRef] [Google Scholar]
- Lutovinov, A., Rodriguez, J., Revnivtsev, M., & Shtykovskiy, P. 2005, A&A, 433, L41 [NASA ADS] [CrossRef] [EDP Sciences] [Google Scholar]
- Lutovinov, A., Tsygankov, S., & Chernyakova, M. 2012, MNRAS, 423, 1978 [NASA ADS] [CrossRef] [Google Scholar]
- Mainzer, A., Bauer, J., Cutri, R. M., et al. 2014, ApJ, 792, 30 [Google Scholar]
- Maitra, C., Haberl, F., Carpano, S., et al. 2020, ATel, 13610, 1 [Google Scholar]
- Masci, F. J., Laher, R. R., Rusholme, B., et al. 2019, PASP, 131, 018003 [Google Scholar]
- Mereminskiy, I., Medvedev, P., Lutovinov, A., et al. 2020, ATel, 14206, 1 [NASA ADS] [Google Scholar]
- Molkov, S., Lutovinov, A., Tsygankov, S., Mereminskiy, I., & Mushtukov, A. 2019, ApJ, 883, L11 [NASA ADS] [CrossRef] [Google Scholar]
- Molkov, S., Doroshenko, V., Lutovinov, A., et al. 2021, ApJ, 915, L27 [NASA ADS] [CrossRef] [Google Scholar]
- Moore, A. M., & Kasliwal, M. M. 2019, Nat. Astron., 3, 109 [NASA ADS] [CrossRef] [Google Scholar]
- Munari, U., & Zwitter, T. 1997, A&A, 318, 269 [NASA ADS] [Google Scholar]
- Oke, J. B., Cohen, J. G., Carr, M., et al. 1995, PASP, 107, 375 [Google Scholar]
- Pavlinsky, M., Tkachenko, A., Levin, V., et al. 2021, A&A, 650, A42 [EDP Sciences] [Google Scholar]
- Predehl, P., Andritschke, R., Arefiev, V., et al. 2021, A&A, 647, A1 [EDP Sciences] [Google Scholar]
- Reig, P. 2011, Ap&SS, 332, 1 [Google Scholar]
- Reig, P., & Fabregat, J. 2015, A&A, 574, A33 [NASA ADS] [CrossRef] [EDP Sciences] [Google Scholar]
- Saxton, R. D., Read, A. M., Esquej, P., et al. 2008, A&A, 480, 611 [NASA ADS] [CrossRef] [EDP Sciences] [Google Scholar]
- Scargle, J. D. 1982, ApJ, 263, 835 [Google Scholar]
- Sheinis, A. I., Bolte, M., Epps, H. W., et al. 2002, PASP, 114, 851 [Google Scholar]
- Sidoli, L., Mereghetti, S., Sguera, V., & Pizzolato, F. 2012, MNRAS, 420, 554 [Google Scholar]
- Skrutskie, M. F., Cutri, R. M., Stiening, R., et al. 2006, AJ, 131, 1163 [NASA ADS] [CrossRef] [Google Scholar]
- Sunyaev, R., Arefiev, V., Babyshkin, V., et al. 2021, A&A, 656, A132 [NASA ADS] [CrossRef] [EDP Sciences] [Google Scholar]
- Syunyaev, R. A., Arefev, V. A., Borozdin, K. N., et al. 1991, Sov. Astron. Lett., 17, 409 [Google Scholar]
- Titarchuk, L. 1994, ApJ, 434, 570 [NASA ADS] [CrossRef] [Google Scholar]
- Tsygankov, S. S., & Lutovinov, A. A. 2005, Astron. Lett., 31, 88 [NASA ADS] [CrossRef] [Google Scholar]
- Tsygankov, S. S., Mushtukov, A. A., Suleimanov, V. F., et al. 2017a, A&A, 608, A17 [NASA ADS] [CrossRef] [EDP Sciences] [Google Scholar]
- Tsygankov, S. S., Wijnands, R., Lutovinov, A. A., Degenaar, N., & Poutanen, J. 2017b, MNRAS, 470, 126 [Google Scholar]
- van Velzen, S., Gezari, S., Cenko, S. B., et al. 2019, ApJ, 872, 198 [Google Scholar]
- Wachter, K., Leach, R., & Kellogg, E. 1979, ApJ, 230, 274 [NASA ADS] [CrossRef] [Google Scholar]
- Waters, C. Z., Magnier, E. A., Price, P. A., et al. 2020, ApJS, 251, 4 [NASA ADS] [CrossRef] [Google Scholar]
- Wegner, W. 2015, Astron. Nachr., 336, 159 [NASA ADS] [CrossRef] [Google Scholar]
- Wisniewski, J. P., Draper, Z. H., Bjorkman, K. S., et al. 2010, ApJ, 709, 1306 [NASA ADS] [CrossRef] [Google Scholar]
- Wright, E. L., Eisenhardt, P. R. M., Mainzer, A. K., et al. 2010, AJ, 140, 1868 [Google Scholar]
- Yao, Y., Kulkarni, S. R., & Hillenbrand, L. 2020, ATel, 14232, 1 [NASA ADS] [Google Scholar]
- Yuan, H. B., & Liu, X. W. 2012, MNRAS, 425, 1763 [NASA ADS] [CrossRef] [Google Scholar]
The ZTF astrometric accuracy at r ~ 17.5 is 0.13" (van Velzen et al. 2019).
See details at https://web.ipac.caltech.edu/staff/fmasci/ztf/forcedphot.pdf
Defined as PF = (Fmax - Fmin)/(Fmax + Fmin), where and Fmin are maximum and minimum fluxes in the pulse profile, respectively.
All Tables
All Figures
|
Fig. 1 Long-term variability of SRGA J204318.2+443815 in different wavebands. Upper, light curve of SRGA J204318.2+443815 obtained with Swift/XRT (black points) and eROSITA (blue crosses) in the 0.5–l0keV energy band and with ART-XC (red crosses) in the 4–12 keV energy band. The times of the source observations with other X-ray instruments are shown with vertical grey lines: SRG (long dash-dotted line), NICER (dashed line), XMM-Newton (dash-dotted line), and NuS-TAR (long dashed line). The source fluxes measured by ART-XC and eROSITA during the discovery and in the first and third surveys are shown with the red asterisk and blue crosses, respectively. The upper limits for the source flux from the XMM-Newton slew surveys in April 2020 and December 2011 are shown by the red circle and red dotted line, respectively. Middle: dependence of the photon index assuming a simple absorbed power-law spectral model with NH fixed at the value of 4.5 × 1022 cm−2, determined from the average spectrum. Bottom: long-term optical light curve of ZTF18abjpmzf in g (r) filters shown in green (red). Earliest measurements (dots) are from the SDSS, PanSTARRS data are shown with pluses, and ZTF data are shown with crosses. J-Alter measurements from PGIR (shifted for clarity by +4 magnitudes) are shown with black dots. A secular long-term brightening is clearly seen in r-filter measurements, along with the irregular short-scale low-amplitude variability. |
| In the text | |
|
Fig. 2 Spectra of SRGA J204318.2+443815 measured with SRG instruments. Blue and red points correspond to eROSITA and ART-XC observations in the second survey, respectively. Cyan points represent the spectrum obtained by eROSITA during the first survey. Solid and dashed lines are the corresponding best-fit models. |
| In the text | |
|
Fig. 3 Periodogram of the source, obtained by NuSTAR (black) and XMM-Newton (red). A coherent signal is clearly detected by both instruments around ≃742 s. |
| In the text | |
|
Fig. 4 Pulse profiles of SRGA J204318.2+443815 as a function of the energy as observed by XMM-Newton (left) and NuSTAR (right). The blue profile represents results obtained from the NICER data in the 2–6 keV band. Zero-phase in both datasets is chosen arbitrarily to coincide with the main minimum in the profile. |
| In the text | |
|
Fig. 5 Pulsed fraction of SRGA J204318.2+443815 as a function of the energy as observed by XMM-Newton (blue circles) and NuSTAR (black squares). |
| In the text | |
|
Fig. 6 (a) Energy spectrum of SRGA J204318.2+443815 as measured by Swift/XRT (green points), XMM-Newton (yellow, cyan, and magenta points for PN, MOS1, and MOS2 instruments, respectively) and NuSTAR (blue and red points for the FPMA and FPMB modules, respectively). The black line corresponds to the best-fit model COMPTT+GAUSS+PHABS. (b) Residuals from the model. |
| In the text | |
|
Fig. 7 WISE light curve of ZTF18abjpmzf in the Wl and W2 bands. The lower panels show the zoom of four NEOWISE visits. |
| In the text | |
|
Fig. 8 Optical and infrared spectra of SRGA J204318.2+443815/ZTF18abjpmzf. Upper, observed LRIS spectrum of ZTF18abjpmzf. The inset shows the Hα profile in the ESI spectrum, where the instrumental broadening is σinst = l6kms−1. Bottom: observed Tspec spectrum of ZTF18abjpmzf. Wavelength ranges of high atmospheric opacity are masked in grey. |
| In the text | |
|
Fig. 9 Parts of the J and K band spectra with the prominent emission lines obtained with NOTCam on April 25, 2021. |
| In the text | |
Current usage metrics show cumulative count of Article Views (full-text article views including HTML views, PDF and ePub downloads, according to the available data) and Abstracts Views on Vision4Press platform.
Data correspond to usage on the plateform after 2015. The current usage metrics is available 48-96 hours after online publication and is updated daily on week days.
Initial download of the metrics may take a while.