Fig. 6
Download original image
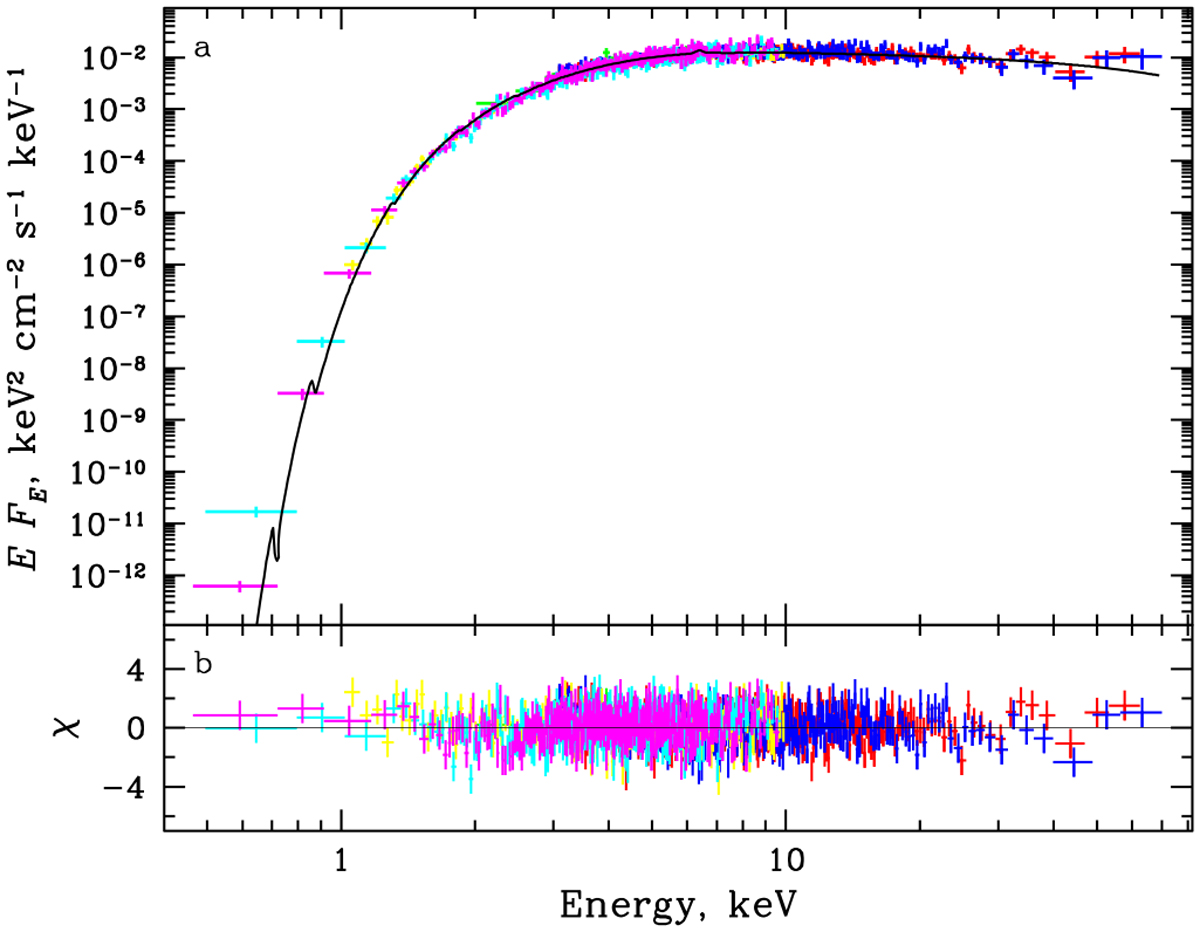
(a) Energy spectrum of SRGA J204318.2+443815 as measured by Swift/XRT (green points), XMM-Newton (yellow, cyan, and magenta points for PN, MOS1, and MOS2 instruments, respectively) and NuSTAR (blue and red points for the FPMA and FPMB modules, respectively). The black line corresponds to the best-fit model COMPTT+GAUSS+PHABS. (b) Residuals from the model.
Current usage metrics show cumulative count of Article Views (full-text article views including HTML views, PDF and ePub downloads, according to the available data) and Abstracts Views on Vision4Press platform.
Data correspond to usage on the plateform after 2015. The current usage metrics is available 48-96 hours after online publication and is updated daily on week days.
Initial download of the metrics may take a while.