Fig. 8
Download original image
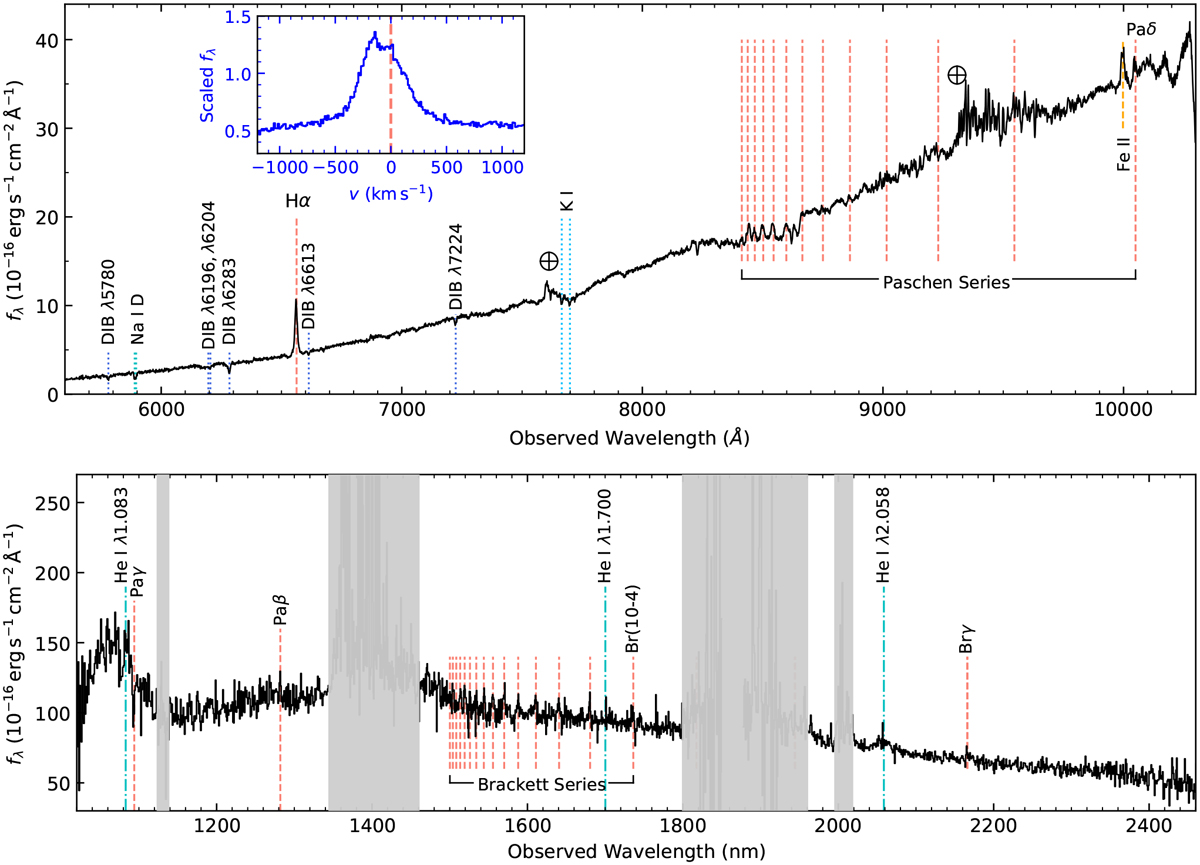
Optical and infrared spectra of SRGA J204318.2+443815/ZTF18abjpmzf. Upper, observed LRIS spectrum of ZTF18abjpmzf. The inset shows the Hα profile in the ESI spectrum, where the instrumental broadening is σinst = l6kms−1. Bottom: observed Tspec spectrum of ZTF18abjpmzf. Wavelength ranges of high atmospheric opacity are masked in grey.
Current usage metrics show cumulative count of Article Views (full-text article views including HTML views, PDF and ePub downloads, according to the available data) and Abstracts Views on Vision4Press platform.
Data correspond to usage on the plateform after 2015. The current usage metrics is available 48-96 hours after online publication and is updated daily on week days.
Initial download of the metrics may take a while.