Fig. 1
Download original image
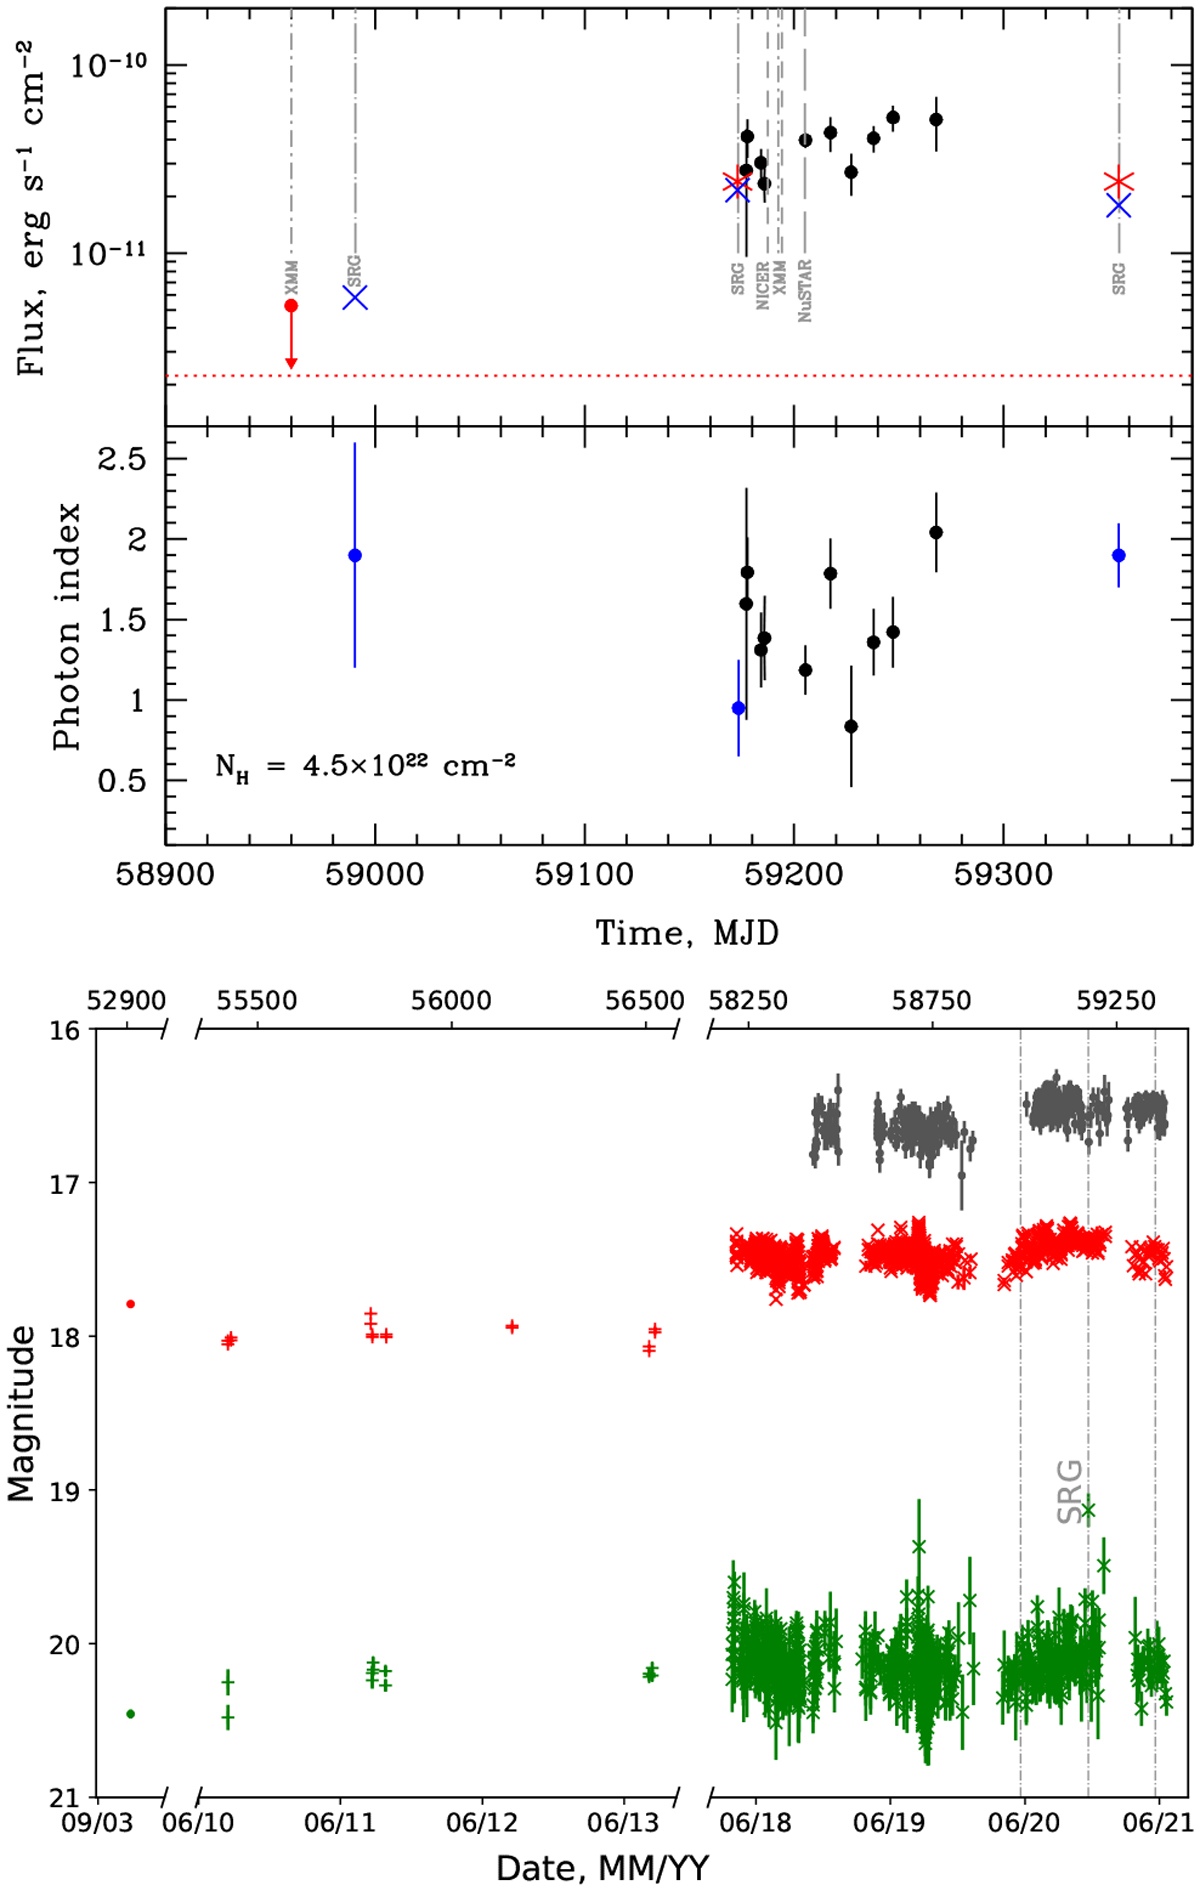
Long-term variability of SRGA J204318.2+443815 in different wavebands. Upper, light curve of SRGA J204318.2+443815 obtained with Swift/XRT (black points) and eROSITA (blue crosses) in the 0.5–l0keV energy band and with ART-XC (red crosses) in the 4–12 keV energy band. The times of the source observations with other X-ray instruments are shown with vertical grey lines: SRG (long dash-dotted line), NICER (dashed line), XMM-Newton (dash-dotted line), and NuS-TAR (long dashed line). The source fluxes measured by ART-XC and eROSITA during the discovery and in the first and third surveys are shown with the red asterisk and blue crosses, respectively. The upper limits for the source flux from the XMM-Newton slew surveys in April 2020 and December 2011 are shown by the red circle and red dotted line, respectively. Middle: dependence of the photon index assuming a simple absorbed power-law spectral model with NH fixed at the value of 4.5 × 1022 cm−2, determined from the average spectrum. Bottom: long-term optical light curve of ZTF18abjpmzf in g (r) filters shown in green (red). Earliest measurements (dots) are from the SDSS, PanSTARRS data are shown with pluses, and ZTF data are shown with crosses. J-Alter measurements from PGIR (shifted for clarity by +4 magnitudes) are shown with black dots. A secular long-term brightening is clearly seen in r-filter measurements, along with the irregular short-scale low-amplitude variability.
Current usage metrics show cumulative count of Article Views (full-text article views including HTML views, PDF and ePub downloads, according to the available data) and Abstracts Views on Vision4Press platform.
Data correspond to usage on the plateform after 2015. The current usage metrics is available 48-96 hours after online publication and is updated daily on week days.
Initial download of the metrics may take a while.