Fig. 4
Download original image
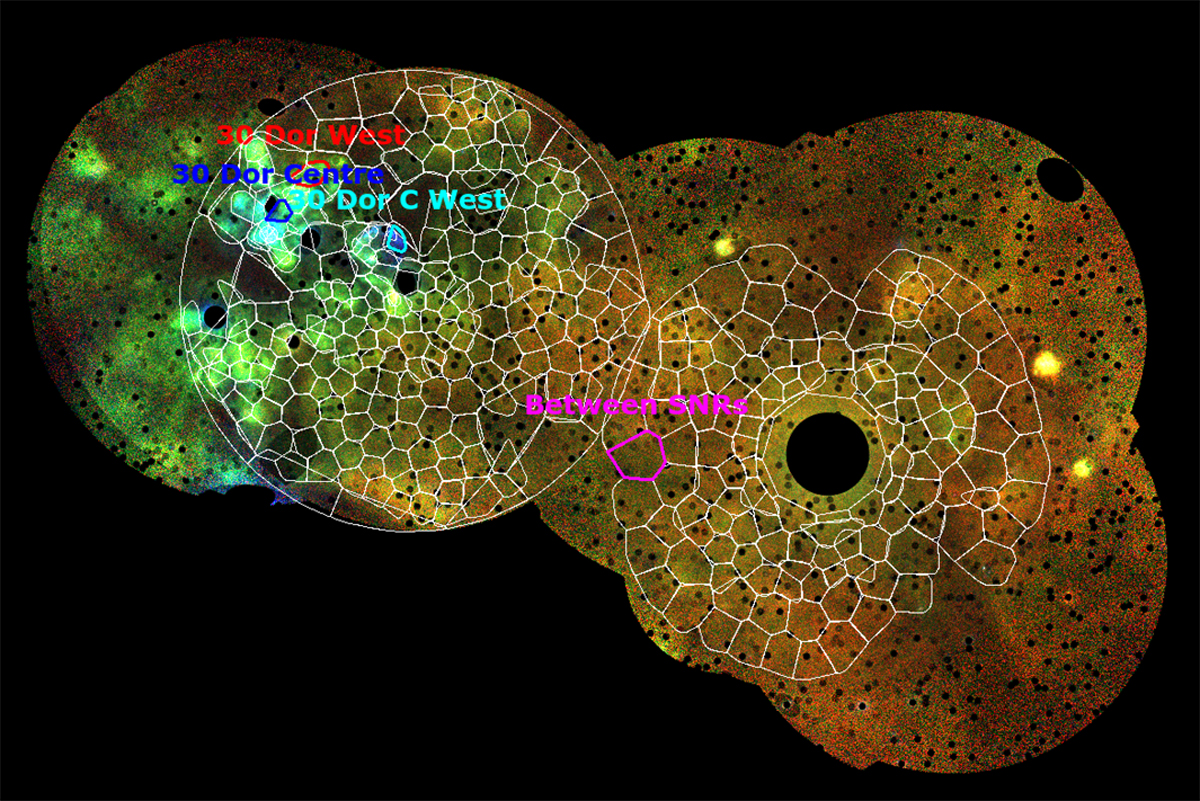
Exposure-corrected mosaic image of the SN 1987A and SNR N132D regions without point sources (red: 0.2−0.5 keV, green = 0.5–1.0 keV, blue = 1.0−2.0 keV) and regions used for spectral analysis. The spectra of the regions shown in colour (30 Dor west, 30 Dor centre, 30 Dor C west, and between SNR N132D and SN 1987A in red, blue, cyan, and magenta, respectively) are shown in Fig. 6.
Current usage metrics show cumulative count of Article Views (full-text article views including HTML views, PDF and ePub downloads, according to the available data) and Abstracts Views on Vision4Press platform.
Data correspond to usage on the plateform after 2015. The current usage metrics is available 48-96 hours after online publication and is updated daily on week days.
Initial download of the metrics may take a while.