| Issue |
A&A
Volume 661, May 2022
The Early Data Release of eROSITA and Mikhail Pavlinsky ART-XC on the SRG mission
|
|
|---|---|---|
| Article Number | A22 | |
| Number of page(s) | 6 | |
| Section | Stellar structure and evolution | |
| DOI | https://doi.org/10.1051/0004-6361/202140867 | |
| Published online | 18 May 2022 | |
eROSITA detection of flares from the Be/X-ray binary A0538-66
1
Institut für Astronomie und Astrophysik, Kepler Center for Astro and Particle Physics, Universität Tübingen,
Sand 1,
72076
Tübingen,
Germany
e-mail: ducci@astro.uni-tuebingen.de
2
ISDC Data Center for Astrophysics, Université de Genève,
16 chemin d’Écogia,
1290
Versoix,
Switzerland
3
INAF - Istituto di Astrofisica Spaziale e Fisica Cosmica,
Via A. Corti 12,
20133
Milano,
Italy
4
Max-Planck-Institut für extraterrestrische Physik,
Gießenbachstraße 1,
85748
Garching,
Germany
5
INAF - Osservatorio Astronomico di Brera,
via Bianchi 46,
23807
Merate (LC),
Italy
6
Universität Erlangen/Nürnberg, Dr.-Remeis-Sternwarte,
Sternwartstraße 7,
96049
Bamberg,
Germany
7
Astronomical Observatory, University of Warsaw Al. Ujazdowskie
4 00-478
Warszawa,
Poland
Received:
23
March
2021
Accepted:
28
May
2021
In 2018, XMM-Newton observed the awakening in X-rays of the Be/X-ray binary (Be/XRB) A0538-66. It showed bright and fast flares close to periastron with properties that had never been observed in other Be/XRBs before. We report the results from the observations of A0538-66 collected during the first all-sky survey of eROSITA, an X-ray telescope (0.2-10 keV) on board the Spektrum-Roentgen-Gamma satellite. eROSITA caught two flares within one orbital cycle at orbital phases φ = 0.29 and φ = 0.93 (where φ = 0 corresponds to periastron), with peak luminosities of ~2-4 × 1036 erg s-1 (0.2-10 keV) and durations of 42 ≤ Δtfl ≤ 5.7 × 10⁴ s. The flare observed at φ ≈ 0.29 shows that the neutron star can accrete considerably far from periastron, although it is expected to be outside of the circumstellar disk, thus providing important new information about the plasma environment surrounding the binary system. We also report the results from the photometric monitoring of A0538-66 carried out with the REM, OGLE, and MACHO telescopes from January 1993 until March 2020. We found that the two sharp peaks that characterize the orbital modulation in the optical occur asymmetrically in the orbit, relative to the position of the donor star.
Key words: accretion, accretion disks / stars: neutron / X-rays: binaries / X-rays: individuals: 1A 0538-66
© ESO 2022
1 Introduction
A0538−66 is a Be/X-ray binary (Be/XRB) in the Large Magellanic Cloud (LMC). It hosts a B1 IIIe star (Rajoelimanana et al. 2017) and a neutron star (NS) whose 69 ms pulsation was detected only once, during a super-Eddington X-ray outburst (Lx ≈ 8×1038 ergs−1 in 1.1–21 keV; Skinner et al. 1982). The orbital period is Porb ≈ 16.64 d and the eccentricity is e ≈ 0.72 (Rajoelimanana et al. 2017, and references therein). The lack of detection of pulsations in all the other outbursts, whose luminosities ranged from ~1034 erg s−1 to ~1038 erg s−1, led Campana et al. (1995) and Corbet et al. (1997) to propose that the accretion onto the NS surface (which produces X-ray pulsations) is only possible when the mass capture rate is very high. When the luminosity is lower, the plasma cannot overcome the centrifugal barrier, and accretion is thus inhibited. Skinner et al. (1982) and Campana et al. (1995) estimated an upper limit for the magnetic dipole moment of μ ≲ 1029 Gcm3 for A0538-66. In 2018, after a long period in which the source showed a faint X-ray emission or was barely detected1, XMM-Newton observed its awakening in two observations carried out near periastron: a remarkable flaring activity consisting of fast flares (~2−50 s) that reached peak luminosities up to ~4 × 1038 erg s−1 (0.2–10 keV). Between the flares, the X-ray luminosity was ~2 × 1035 erg s−1. In a third observation at periastron, XMM-Newton detected A0538−66 at a constant luminosity level of ~2 × 1034 erg s−1 (Ducci et al. 2019c). During these flares, the X-ray spectrum showed two distinct components. The softer component (≲2 keV) was well described by an absorbed power law with photon index Γsoft ≈ 2–4 and column density NH ≈ 1021 cm−2. The harder component (≳2 keV) was described by a power law with photon index Γhard ≈ 0–0.5. The softer component showed larger flux variability than the harder component and a hardening correlated with the flux. No statistically significant pulsations were detected. A flaring activity with these properties has not been observed in other Be/XRBs. Most of them show a weak X-ray emission (Lx ≲ 1034−1035 ergs−1) interrupted by periodic or sporadic outbursts (typically Lx ≲ 1038 erg s−1) that last from several days to weeks. The X-ray outbursts are caused by the accretion of plasma from the circumstellar disk of the Be star onto the NS (see Reig 2011, for a review). It is argued that the activation mechanism of the X-ray outbursts and their main properties (duration and peak luminosity) depend on the interactions between the compact object and a warped, eccentric, and truncated circumstellar disk (Laplace et al. 2017; Martin et al. 2011, 2014; Okazaki et al. 2002).
A0538−66 also shows a striking variability in the optical, characterized by periodic outbursts associated with the X-ray outbursts. They are the brightest optical outbursts observed in Be/XRBs. The brightest outbursts (Δmv ≈ 2.2; Charles et al. 1983) are likely powered by the X-ray photons produced by the accreting NS, which are reprocessed in an envelope surrounding the binary system. For the faintest flares, the production mechanism is unknown: it could be the same as for the bright flares, although the heating of the surface of the donor star irradiated by the NS or other mechanisms cannot be excluded (Ducci et al. 2019b, and references therein). Photometric data from 1915 to 1998, based on UV Schmidt and Harvard photographic plates and Massive Compact Halo Objects (MACHO) data, revealed a long-term modulation of Psup = 420.8 ± 0.8 d, with a reddening at low fluxes and the lack of the ~ 16.64 d flares and of the Hα emission line during the high-luminosity state of the ~420 d cycle. The long-term variability was explained with the formation and depletion of a circumstellar disk observed edge-on (Alcock et al. 2001; McGowan & Charles 2003; Ducci et al. 2016; Rajoelimanana et al. 2017). Schmidtke et al. (2014) analyzed the Optical Gravitational Lensing Experiment (OGLE IV) observations and showed that since 2010, the long-term variability began to occur on irregular timescales. This new behavior was later observed with the Rapid Eye Mount (REM) telescope (Ducci et al. 2016). The MACHO and OGLE light curves folded at the orbital period show two sharp peaks around periastron. The lack of an eclipse implies that the orbital plane is not observed edge-on, and it must thus have a substantial inclination with respect to the circumstellar disk (Rajoelimanana et al. 2017).
We report the results of the analysis of the data of A0538−66 from the first eROSITA all-sky survey. A0538−66 was detected in X-rays and surprisingly showed an X-ray flare far from periastron. No optical data are available during the X-ray brightening detected by eROSITA. Despite this, a new analysis of the MACHO and OGLE data, enriched with the data from a daily monitoring specifically tailored for this source performed with REM (a large part of which we present here for the first time), shows other important properties of A0538−66.
2 Data analysis
2.1 Optical photometric data
We used the available MACHO, OGLE, and REM photometric data of A0538−66. We retrieved the MACHO data2 that cover the time interval 49001.6−51542.6 MJD (14 January 1993−30 December 1999), and we extracted the photometric light curve in the V and R bands using the calibration procedure described in Alcock et al. (1999, Alcock et al. 2001). We retrieved the OGLE data3, corrected to the standard I-band system (Udalski 2008). The OGLE data cover the time interval 55 260.1–58 921.1 MJD (5 March 2010−13 March 2020). We also used the REM photometric data in the g, r, i bands. REM is a fully automatic, fast-reacting telescope with a 60 cm primary mirror at the ESO La Silla Observatory (Covino et al. 2004; Zerbi et al. 2004). It hosts the ROSS2 optical camera (g, r, i, z; Tosti et al. 2004) and the REMIR near-infrared camera (J, H, K; Conconi et al. 2004). REM allows observing a target in five bands simultaneously (one in the near-infrared band, and four in the optical band). REM data provide a long-term monitoring of this source that consists of a denser sampling (almost daily monitoring) than the MACHO and OGLE data sets, and is thus ideal for studying the fast variability shown by A0538−66. These data cover the time intervals 56 903.2–57 223.4 MJD (3 September 2014−20 July 2015) and 57 477.0–58 929.3 MJD (30 March 2016−21 March 2020). For data reduction methods, we refer to Sect. 2 in Ducci et al. (2016), where the results from the first part of the data were presented.
2.2 eROSITA
The extended ROentgen Survey with an Imaging Telescope Array (eROSITA) is the soft X-ray instrument on board the Russian/German Spektrum-Roentgen-Gamma (SRG) mission, launched in July 2019 and placed in orbit around the L2 Lagrangian point (Merloni et al. 2012). eROSITA consists of seven identical mirror modules combined with as many pn-CCDs operating in the 0.2–10 keV energy range. It has an angular resolution of ≲15″ and a field of view of 1.03°. In December 2019, eROSITA started a four-year-long all-sky survey, composed of eight passages over the entire sky. eROSITA scans are regular, with an average uniform exposure of ~ 150–200 s over most of the sky. One of the two ecliptic poles is close to the position of the LMC. This region is thus observed more frequently, and a total exposure of up to a few hours is reached (Predehl et al. 2021). Additionally, the LMC was observed a few days prior to the start of the first survey as part of a test observations program. Therefore eROSITA observed the region around A0538−66 several times, from 8 December 2019 at 16:01:12 (UTC) until 7 June 2020 at 16:58:48 (UTC), corresponding to the time interval 58 825.6675–59 007.7075 MJD, for a net exposure time of ~4666 s.
We reduced the data with the eROSITA Standard Analysis Software System (eSASS), version 201009, pipeline configuration c946. We did not use data from the telescope modules without on-chip filters for blocking optical light (TM5 and TM7) because their energy calibration is unreliable. First, we ran the source detection in the energy range 0.2–10 keV, adopting a minimum detection likelihood of L = 6. (the detection likelihood is defined as L = - ln(p), where p is the probability that a Poisso-nian function in the background is detected as a spurious source). A0538−66 was clearly detected with a likelihood of L ≈ 250.
3 Results
3.1 Optical data
We removed the long-term modulation in the optical data and obtained the detrended light curve as follows. In each data set (MACHO, OGLE, and REM), we temporarily removed the fast periodic flares (~16.6 d). Then, we divided each data set into smaller segments of length ~ 100–150 d. Each segment was fit with a third-order polynomial. The best-fit functions were then subtracted from the original light curves. The orbital modulation of A0538−66 is not sinusoidal (e.g., Rajoelimanana et al. 2017). Therefore we searched for periodicity using the phase dispersion minimization (PDM) periodogram (Stellingwerf 1978), which is better suited for this type of signal. To obtain a better measurement of the periodicity and to search for possible orbital decay, we again divided the detrended light curve into five subsets: (1) MACHO, (2) OGLE part 1 (55260.100–57090.613 MJD), (3) OGLE part 2 (57090.613–58921.000 MJD), and 4) REM part 1 and REM part 2 (see Sect. 2.1). Then, we performed a phase-coherent timing analysis, using a linear and a quadratic function (e.g., Dall’Osso et al. 2003; Falanga et al. 2015). We find that the linear function is sufficient to obtain a statistically acceptable solution for the ephemeris of the optical outburst (χ2 = 1.15, 3 degrees of freedom): To = 55 673.71 ± 0.05 MJD (position of the first peak), and Porb = 16.64002 ± 0.00026 d. The second peak falls Δϕ ≈ 0.07 after the first. The top two panels of Fig. 1 display the MACHO, OGLE, and REM light curves. The yellow regions show time intervals without flaring activity, called “quiescent state” by Alcock et al. (2001) and McGowan & Charles (2003), as opposed to the “active states”, when A0538−66 shows X-ray and optical flares. The light curves of these two panels show the vanishing of the superorbital period, which might be explained with a circumstellar disk that becomes more stable over the years in which the depletion events are more sporadic. The third panel shows the binned light curve (filled blue circles) and the individual points (empty colored circles) folded at the orbital period. Phase zero corresponds to the periastron passage (see the orbital ephemeris in Rajoelimanana et al. 2017). The lower panel shows the optical light curves folded at the orbital period divided between active and quiescent states. The difference between the phases of the peaks reported in this work and in Rajoelimanana et al. (2017) arises because we used a larger data set, which enabled us to obtain a more accurate ephemeris.
Bright flares are clustered in the narrow orbital phase range −0.075 ≲ ϕ ≲ 0.075, with the exception of one point at phase ϕ ≈ 0.64. It corresponds to an event detected by MACHO on 50 160.67 MJD (18 March 1996). No X-ray observations correspond to this event. We also note that the MACHO observations before and after this event were taken on 50 154.6 MJD and 50 173.5 MJD, when A0538−66 was faint in the optical. Because this interval is quite long, it is possible that the bright event detected on 50 160.67 MJD was part of a longer (up to ~20 d) optical and X-ray outburst, similar to the outbursts observed in 1970s-1980s. The profile shown in Fig. 1 is reminiscent of the fast rise-exponential decay (FRED) profiles seen in many other Be/XRBs (Bird et al. 2012) with the difference that A0538−66 shows a double peak (or, in an alternative interpretation, a dip at the position of the expected peak).
Figure 2 shows the g − i color folded on the orbital period of A0538−66, built using the second part of the REM data. This subset was ideal to study the g − i variability because in addition to the ~16.6 d orbital variability, it does not show the longterm modulation previously seen, especially in MACHO data (see the light curve of the recent REM monitoring of A0538−66 in Fig. 3). Figure 2 shows that A0538−66 is redder at high luminosities.
3.2 eROSITA
Figure 4 shows the 0.2−10 keV light curve of A0538−66. It is built using events extracted from a circular region with radius 50″ centered on the source position (RA: 05:35:41.00 Dec: −66 51 53.5). Background counts were accumulated from a circular region with J2000 coordinates RA: 05:36:15.39 Dec: −66:52:29.6 radius: 106″, inside which we excluded a circular region with coordinates RA: 05:32:07.65 Dec: −66:52:30.4 and radius 12″, where a faint source was detected.
A0538−66 is detected by eROSITA in four observation scans at ~58 990.87 MJD and ~59001.54 MJD (orbital phases ~0.29 and ~0.93). The upper and lower error bars of the flares were calculated using the Gehrels approximation (Eqs. (9) and (14) in Gehrels 1986). The 90% confidence level (c.l.) upper limits were obtained by binning observations within one day.
The flare at ϕ ~ 0.29 (called flare 1, see Table 1) has a duration between 42.5 s and 28 759.5 s (data gaps prevent a more accurate estimate). Flare 2 (ϕ ~ 0.92) was observed in three eROSITA observation scans. It has a duration between 28 857.0s and 57 542.2 s. The observation scans containing the flares do not have enough statistics to allow a meaningful spectral analysis (the source counts for flares 1 and 2 are 90, and there are 15 background counts). To obtain a rough estimate of the absorbed luminosity, we made use of the eROSITA response file. Then, for the spectral shape, we assumed the best-fit model obtained in Ducci et al. (2019c) for the intermediate state of the flaring activity seen by XMM-Newton. We obtain Lf,1 = 4.2 ± 1.1 × 1036 erg s−1 and Lf,2 = 2.3±0.4× 1036 ergs−1 (0.2–10 keV). Outside of the flares, A0538−66 is neither detected in single observations (the typical 3σ upper limit for the single-observation scans is ≈ 2× 1035 ergs−1) nor in the bins obtained by combining different observation scans, as shown in Fig. 4. A source detection performed in all the observations taken outside the flares combined together does not find any source at the position of A0538−66. Assuming the best-fit model of the low state seen by XMM-Newton (Ducci et al. 2019c) for the spectral shape, we obtain a 3σ upper limit for the absorbed luminosity of Lu.1. = 3.4 × 1034 erg s−1 (0.2–10 keV).
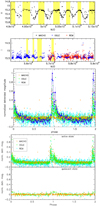 |
Fig. 1 Top two panels: MACHO, OGLE, and REM light curves of A0538−66. Yellow regions show the quiescent states, when the flaring activity is absent (Alcock et al. 2001; McGowan & Charles 2003). Central panel: same data as in the upper panel, folded at the orbital period (Porb = 16.64002 d). Phase zero corresponds to the periastron passage (according to the orbital ephemeris obtained by Rajoelimanana et al. 2017). Filled blue circles show the binned light curve. Colored empty circles are the individual photometric points. Bottom panel: MACHO, OGLE, and REM light curves of A0538−66 folded at the orbital period, divided into two groups: (1) time intervals corresponding to the active state (i.e., with flaring activity and circumstellar disk) and (2) time intervals corresponding to the quiescent state (see yellow regions in the top panel). When error bars are not visible, they are smaller than the plotted symbols. |
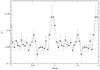 |
Fig. 2 g − i color from REM data taken from 57 477.0 to 58 929.3 MJD (i.e., the second part of the data, where A0538−66 did not show any long-term variability), folded at the orbital period of A0538−66. Phase zero corresponds to the periastron passage. |
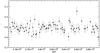 |
Fig. 3 REM light curve of A0538−66 from March 2016 until March 2020. The bin size corresponds to one orbital period. |
4 Discussion
As described in Sect. 1, X-ray and optical data of A0538–66 suggest that the NS orbit and the circumstellar disk are highly misaligned and have two intersections close to the periastron. When the NS is outside of the circumstellar disk, it accretes the fast and tenuous polar wind of the Be star, which leads to low mass accretion rates (the mass-loss rate and terminal velocity of the polar wind of Be stars are M ≈ 10−10−10−8 M⊙ yr−1 and v∞ ≈ 600–1800kms−1; e.g. Waters et al. 1988). When the NS crosses the circumstellar disk, where the outflow from the Be star is denser and slower (in the circumstellar disk M ~ 100–1000 higher and v∞ ~ 10–100 lower than in the polar wind region; e.g. Waters et al. 1988), the higher accretion rate produces X-ray flares, and consequently, optical flares from reprocessing of X-ray photons (Ducci et al. 2019c). There are three points emerging from the observations which are difficult to reconcile with this scenario. First: the flare 1 detected by eROSITA. Second: Table 2 and Fig. 5 show a list of all the X-ray outbursts of A0538−66 observed since its discovery with the orbital phases of the observed peaks. The list shows that the peaks of some outbursts preceeded the expected epochs for the optical flares. Third: Fig. 4 shows that the orbital phases in which the peaks of the two optical flares occur are not compatible with a scenario in which the NS crosses a circumstellar disk twice that entirely lies on the equatorial plane of the Be star. If this had occured, the orbital phases of the flares would be aligned with the center of the Be star.
A highly disturbed environment surrounding the binary system could explain these observational features. Hydrodynamic simulations by Martin et al. (2014, 2011) showed that in binary systems in which the orbital plane and circumstellar disk are misaligned, the disk can become warped and eccentric. The variability of the Hα emission profile during the orbital cycle of A0538−66 observed by Rajoelimanana et al. (2017) supports the hypothesis that the circumstellar disk can be warped. In addition, flare 1 observed by eROSITA and the other flares seen in the past (Table 2) show that the NS might occasionally encounter a structure of gas resulting from tidal interactions at any orbital phase and produce enhanced X-ray emission also far from peri-astron. The reddening at high luminosities (Fig. 2) suggests that optical flares are associated with a brightening of a cold region around the binary system (e.g., produced by a sudden increase in the size of a cold emitting region, likely the circumstellar disk, caused by the tidal displacement of material during periastron passages of the NS). It is unclear whether both optical flares are equally affected by the reddening. More precise observations are critical to clarify this point. We point out that the reddening at high luminosities during the orbital cycle shown in Fig. 2 should not be confused with the reddening at low fluxes during the super-orbital cycle mentioned in Sect. 1, which is caused by the formation of a circumstellar disk observed edge-on.
The recent high X-ray emission observed by eROSITA and XMM-Newton is different from that observed in other high-mass X-ray binaries with Be and OB supergiant donor stars (see the discussion in Ducci et al. 2019c). In particular, the X-ray flares of A0538−66 are remarkably shorter than the X-ray outbursts displayed by the other Be/XRBs, which last for a large fraction of the orbit (≈0.2–0.3 Porb) or for several orbital cycles (e.g., Reig 2011). For most of these Be/XRBs, there is compelling evidence for disk-mediated accretion. Accretion disks were also suggested in the context of the hydrodynamic simulations of Martin et al. (2014) to explain the properties of type II outbursts produced by the mass capture from an eccentric and misaligned circumstellar disk. For A0538−66, long periods of accretion from a spherically symmetric flow seem a more plausible scenario (Ducci et al. 2019c). theless, if an accretion disk of the type of those hypothesized by Syunyaev & Shakura (1977) forms around the NS of A0538−66 and persists for several orbits, a stochastic leakage of matter onto the NS surface could also explain the flare observed by eROSITA at ϕ ≈0.29.
To our knowledge, the Be/XRB that most resembles A0538−66 for its X-ray and optical variability is AX J0049.4– 7323. It is located in the Small Magellanic Cloud and hosts a ~750 s pulsar with an orbital period of ~393 d (Yokogawa et al. 2000; Cowley & Schmidtke 2003; Laycock et al. 2005). AX J0049.4– 7323 shows periodic bright (Lx ≳ 1037 ergs−1) and short (0.05−0.1 Porb) X-ray outbursts that are synchronized with optical outbursts that last as long as the X-ray ourbursts, have optical amplitudes of ΔmI ≈ 0.5, and are characterized by a fast rise-exponential decay profile (Fig. 2 in Ducci et al. 2019a). They occur at the same orbital phase, likely at periastron. Except for A0538 − 66, these are the brightest optical outbursts associated with the orbital period seen in Be/XRBs. Moreover, AX J0049.4–7323 reddens during the flares, possibly because of the brightening of the circumstellar disk during the outbursts (Ducci et al. 2019a; Cowley & Schmidtke 2003). Another similarity with A0538 − 66 is that AX J0049.4– 7323 sometimes shows substantial X-ray variability (by a factor of ~270) with peak luminosities of ≈2 x 1036 erg s−1 far from periastron (Ducci et al. 2018, and references therein). Coe & Edge (2004) pointed out that two other very little studied Be/XRBs, RX J0058.2− 7231 and RX J0520.5–6932, show signs of highly disturbed circumstellar disks. These four sources could thus be the members of a noteworthy subclass of Be/XRBs.
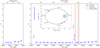 |
Fig. 4 eROSITA light curve (0.2–10 keV) of A0538−66 of the first sky survey. Each point during the flares represents one scan. Outside of the flares, the 90% c.l. upper limit was obtained by binning the data within one day. The top horizontal axis shows the orbital phase, and phase zero corresponds to the periastron passage. The inset shows the position of the eROSITA flares (blue stars) and of the optical peaks (red squares) in the orbit. |
Summary tables of the flares and low-luminosity level of A0538-66 seen by eROSITA.
5 Conclusion
eROSITA confirmed the anomalous flaring activity of A0538−66 previously seen by XMM-Newton in 2018, and it detected an unexpected flare far from periastron. We propose that this flare and the other observational features emerging from optical data and previous X-ray observations could be qualitatively explained if the binary system were surrounded by an inhomogeneous environment, likely a warped circumstellar disk, possibly with noncoplanar structures of gas detached from the disk through tidal interactions with the NS. This hypothesis is mostly based on hydrodynamic simulations by Martin et al. (2014) for a binary system with an orbital period of ~24 days and a moderate eccentricity (e = 0.34), and it is supported by the spectroscopic observations of A0538−66 reported in Rajoelimanana et al. (2017). Although the results of the simulations of Martin et al. (2014) are generally applicable to other Be/XRBs, the extreme properties of A0538−66 (e.g., it has one of the shortest orbital period and highest eccentricity of all Be/XRBs, as well as a very high misalignment between the circumstellar disk and the orbital plane) require further hydrodynamic simulations that are specifically tailored for this source. We also point out that a growing number of Be/XRBs with similar properties might benefit from this study.
Summary table of all the observed X-ray flares of A0538−66 since its discovery.
Acknowledgements
We thank the anonymous referee for constructive comments that helped to improve the paper. This work is partially supported by the Bun-desministerium für Wirtschaft und Energie through the Deutsches Zentrum für Luft- und Raumfahrt e.V. (DLR) under the grants FKZ 50 QR 2102 and DLR 50 QR 2103. S.M. acknowledges support through grants ASI-INAF n.2017-14-H.0, MIUR 2017LJ39LM “UNIAM” and INAF PRIN-SKA/CTA. The OGLE project has received funding from the National Science Centre, Poland, grant MAESTRO 2014/14/A/ST9/00121 to AU. This work is based on data from eROSITA, the soft X-ray instrument aboard SRG, a joint Russian-German science mission supported by the Russian Space Agency (Roskosmos), in the interests of the Russian Academy of Sciences represented by its Space Research Institute (IKI), and the Deutsches Zentrum für Luft- und Raumfahrt (DLR). This paper utilizes public domain data obtained by the MACHO Project, jointly funded by the US Department of Energy through the University of California, Lawrence Livermore National Laboratory under contract No. W-7405-Eng-48, by the National Science Foundation through the Center for Particle Astrophysics of the University of California under cooperative agreement AST-8 809 616, and by the Mount Stromlo and Siding Spring Observatory, part of the Australian National University.
References
- Alcock, C., Allsman, R. A., Alves, D. R., et al. 1999, PASP, 111, 1539 [NASA ADS] [CrossRef] [Google Scholar]
- Alcock, C., Allsman, R. A., Alves, D. R., et al. 2001, MNRAS, 321, 678 [NASA ADS] [CrossRef] [Google Scholar]
- Bird, A. J., Coe, M. J., McBride, V. A., & Udalski, A. 2012, MNRAS, 423, 3663 [NASA ADS] [CrossRef] [Google Scholar]
- Campana, S., Stella, L., Mereghetti, S., & Colpi, M. 1995, A&A, 297, 385 [NASA ADS] [Google Scholar]
- Charles, P.A., Booth, L., Densham, R. H., et al. 1983, MNRAS, 202, 657 [NASA ADS] [CrossRef] [Google Scholar]
- Coe, M. J., & Edge, W. R. T. 2004, MNRAS, 350, 756 [NASA ADS] [CrossRef] [Google Scholar]
- Conconi, P., Cunniffe, R., D'Alessio, F., et al. 2004, SPIE Conf. Ser., 5492, 1602 [NASA ADS] [Google Scholar]
- Corbet, R. H. D., Charles, P. A., Southwell, K. A., & Smale, A. P. 1997, ApJ, 476, 833 [NASA ADS] [CrossRef] [Google Scholar]
- Covino, S., Stefanon, M., Sciuto, G., et al. 2004, SPIE Conf. Ser., 5492, 1613 [NASA ADS] [Google Scholar]
- Cowley, A. P., & Schmidtke, P. C. 2003, AJ, 126, 2949 [NASA ADS] [CrossRef] [Google Scholar]
- Dall’Osso, S., Israel, G. L., Stella, L., Possenti, A., & Perozzi, E. 2003, ApJ, 599, 485 [CrossRef] [Google Scholar]
- Ducci, L., Covino, S., Doroshenko, V., et al. 2016, A&A, 595, A103 [NASA ADS] [CrossRef] [EDP Sciences] [Google Scholar]
- Ducci, L., Romano, P., Malacaria, C., et al. 2018, A&A, 614, A34 [NASA ADS] [CrossRef] [EDP Sciences] [Google Scholar]
- Ducci, L., Malacaria, C., Romano, P., et al. 2019a, A&A, 621, A94 [NASA ADS] [CrossRef] [EDP Sciences] [Google Scholar]
- Ducci, L., Mereghetti, S., Hryniewicz, K., Santangelo, A., & Romano, P. 2019b, A&A, 624, A9 [NASA ADS] [CrossRef] [EDP Sciences] [Google Scholar]
- Ducci, L., Mereghetti, S., & Santangelo, A. 2019c, ApJ, 881, L17 [NASA ADS] [CrossRef] [Google Scholar]
- Falanga, M., Bozzo, E., Lutovinov, A., et al. 2015, A&A, 577, A130 [NASA ADS] [CrossRef] [EDP Sciences] [Google Scholar]
- Gehrels, N. 1986, ApJ, 303, 336 [Google Scholar]
- Kretschmar, P., Wilms, J., Staubert, R., Kreykenbohm, I., & Heindl, W. A. 2004, ESA SP, 552, 329 [NASA ADS] [Google Scholar]
- Laplace, E., Mihara, T., Moritani, Y., et al. 2017, A&A, 597, A124 [NASA ADS] [CrossRef] [EDP Sciences] [Google Scholar]
- Laycock, S., Corbet, R. H. D., Coe, M. J., et al. 2005, ApJS, 161, 96 [NASA ADS] [CrossRef] [Google Scholar]
- Martin, R. G., Pringle, J. E., Tout, C. A., & Lubow, S. H. 2011, MNRAS, 416, 2827 [NASA ADS] [CrossRef] [Google Scholar]
- Martin, R. G., Nixon, C., Armitage, P. J., Lubow, S. H., & Price, D. J. 2014, ApJ, 790, L34 [Google Scholar]
- Mavromatakis, F., & Haberl, F. 1993, A&A, 274, 304 [NASA ADS] [Google Scholar]
- McGowan, K. E., & Charles, P. A. 2003, MNRAS, 339, 748 [NASA ADS] [CrossRef] [Google Scholar]
- Merloni, A., Predehl, P., Becker, W., et al. 2012, ArXiv e-prints [arXiv:1209.3114] [Google Scholar]
- Okazaki, A. T., Bate, M. R., Ogilvie, G. I., & Pringle, J. E. 2002, MNRAS, 337, 967 [NASA ADS] [CrossRef] [Google Scholar]
- Ponman, T. J., Skinner, G. K., & Bedford, D. K. 1984, MNRAS, 207, 621 [NASA ADS] [Google Scholar]
- Predehl, P., Andritschke, R., Arefiev, V., et al. 2021, A&A, 647, A1 [EDP Sciences] [Google Scholar]
- Rajoelimanana, A. F., Charles, P. A., Meintjes, P. J., et al. 2017, MNRAS, 464, 4133 [NASA ADS] [CrossRef] [Google Scholar]
- Reig, P. 2011, Ap&SS, 332, 1 [Google Scholar]
- Schmidtke, P.C., Cowley, A. P., & Udalski, A. 2014, ATel, 6135, 1 [NASA ADS] [Google Scholar]
- Skinner, G. K., Shulman, S., Share, G., et al. 1980, ApJ, 240, 619 [NASA ADS] [CrossRef] [Google Scholar]
- Skinner, G. K., Bedford, D. K., Elsner, R. F., et al. 1982, Nature, 297, 568 [NASA ADS] [CrossRef] [Google Scholar]
- Stellingwerf, R. F. 1978, ApJ, 224, 953 [Google Scholar]
- Syunyaev, R. A., & Shakura, N. I. 1977, Sov. Astron. Lett., 3, 138 [NASA ADS] [Google Scholar]
- Tosti, G., Bagaglia, M., Campeggi, C., et al. 2004, SPIE Conf. Ser., 5492, 689 [NASA ADS] [Google Scholar]
- Udalski, A. 2008, Acta Astron., 58, 187 [NASA ADS] [Google Scholar]
- Waters, L. B. F. M., van den Heuvel, E. P. J., Taylor, A. R., Habets, G. M. H. J., & Persi, P. 1988, A&A, 198, 200 [NASA ADS] [Google Scholar]
- Yokogawa, J., Imanishi, K., Ueno, M., & Koyama, K. 2000, PASJ, 52, L73 [NASA ADS] [Google Scholar]
- Zerbi, F. M., Chincarini, G., Ghisellini, G., et al. 2004, SPIE Conf. Ser., 5492, 1590 [NASA ADS] [Google Scholar]
For example, in an XMM-Newton observation carried out in 2002, A0538-66 showed an X-ray luminosity of Lx ≈ 5-8 × 1033 erg s-1 in 0.3-10 keV (Kretschmar et al. 2004).
http://macho.anu.edu.au A0538-66 identified as 61.9045.32 in the MACHO catalogue.
All Tables
Summary tables of the flares and low-luminosity level of A0538-66 seen by eROSITA.
All Figures
|
Fig. 1 Top two panels: MACHO, OGLE, and REM light curves of A0538−66. Yellow regions show the quiescent states, when the flaring activity is absent (Alcock et al. 2001; McGowan & Charles 2003). Central panel: same data as in the upper panel, folded at the orbital period (Porb = 16.64002 d). Phase zero corresponds to the periastron passage (according to the orbital ephemeris obtained by Rajoelimanana et al. 2017). Filled blue circles show the binned light curve. Colored empty circles are the individual photometric points. Bottom panel: MACHO, OGLE, and REM light curves of A0538−66 folded at the orbital period, divided into two groups: (1) time intervals corresponding to the active state (i.e., with flaring activity and circumstellar disk) and (2) time intervals corresponding to the quiescent state (see yellow regions in the top panel). When error bars are not visible, they are smaller than the plotted symbols. |
| In the text | |
|
Fig. 2 g − i color from REM data taken from 57 477.0 to 58 929.3 MJD (i.e., the second part of the data, where A0538−66 did not show any long-term variability), folded at the orbital period of A0538−66. Phase zero corresponds to the periastron passage. |
| In the text | |
|
Fig. 3 REM light curve of A0538−66 from March 2016 until March 2020. The bin size corresponds to one orbital period. |
| In the text | |
|
Fig. 4 eROSITA light curve (0.2–10 keV) of A0538−66 of the first sky survey. Each point during the flares represents one scan. Outside of the flares, the 90% c.l. upper limit was obtained by binning the data within one day. The top horizontal axis shows the orbital phase, and phase zero corresponds to the periastron passage. The inset shows the position of the eROSITA flares (blue stars) and of the optical peaks (red squares) in the orbit. |
| In the text | |
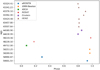 |
Fig. 5 Phases of the observed X-ray flares of A0538-66 shown in Table 2. |
| In the text | |
Current usage metrics show cumulative count of Article Views (full-text article views including HTML views, PDF and ePub downloads, according to the available data) and Abstracts Views on Vision4Press platform.
Data correspond to usage on the plateform after 2015. The current usage metrics is available 48-96 hours after online publication and is updated daily on week days.
Initial download of the metrics may take a while.