Fig. 4
Download original image
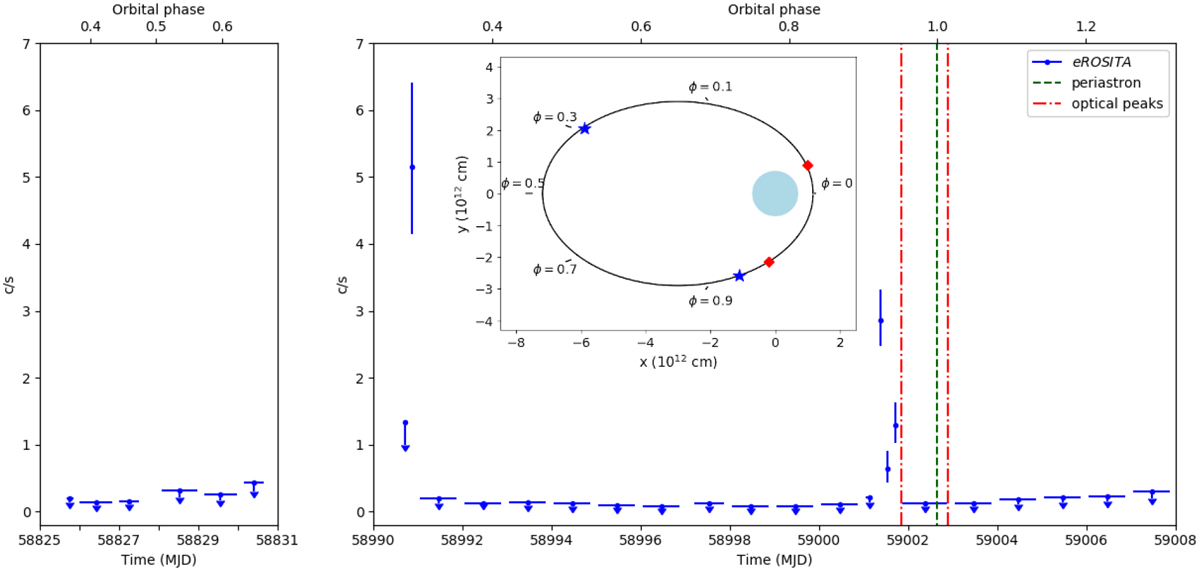
eROSITA light curve (0.2–10 keV) of A0538−66 of the first sky survey. Each point during the flares represents one scan. Outside of the flares, the 90% c.l. upper limit was obtained by binning the data within one day. The top horizontal axis shows the orbital phase, and phase zero corresponds to the periastron passage. The inset shows the position of the eROSITA flares (blue stars) and of the optical peaks (red squares) in the orbit.
Current usage metrics show cumulative count of Article Views (full-text article views including HTML views, PDF and ePub downloads, according to the available data) and Abstracts Views on Vision4Press platform.
Data correspond to usage on the plateform after 2015. The current usage metrics is available 48-96 hours after online publication and is updated daily on week days.
Initial download of the metrics may take a while.