Fig. 1

Download original image
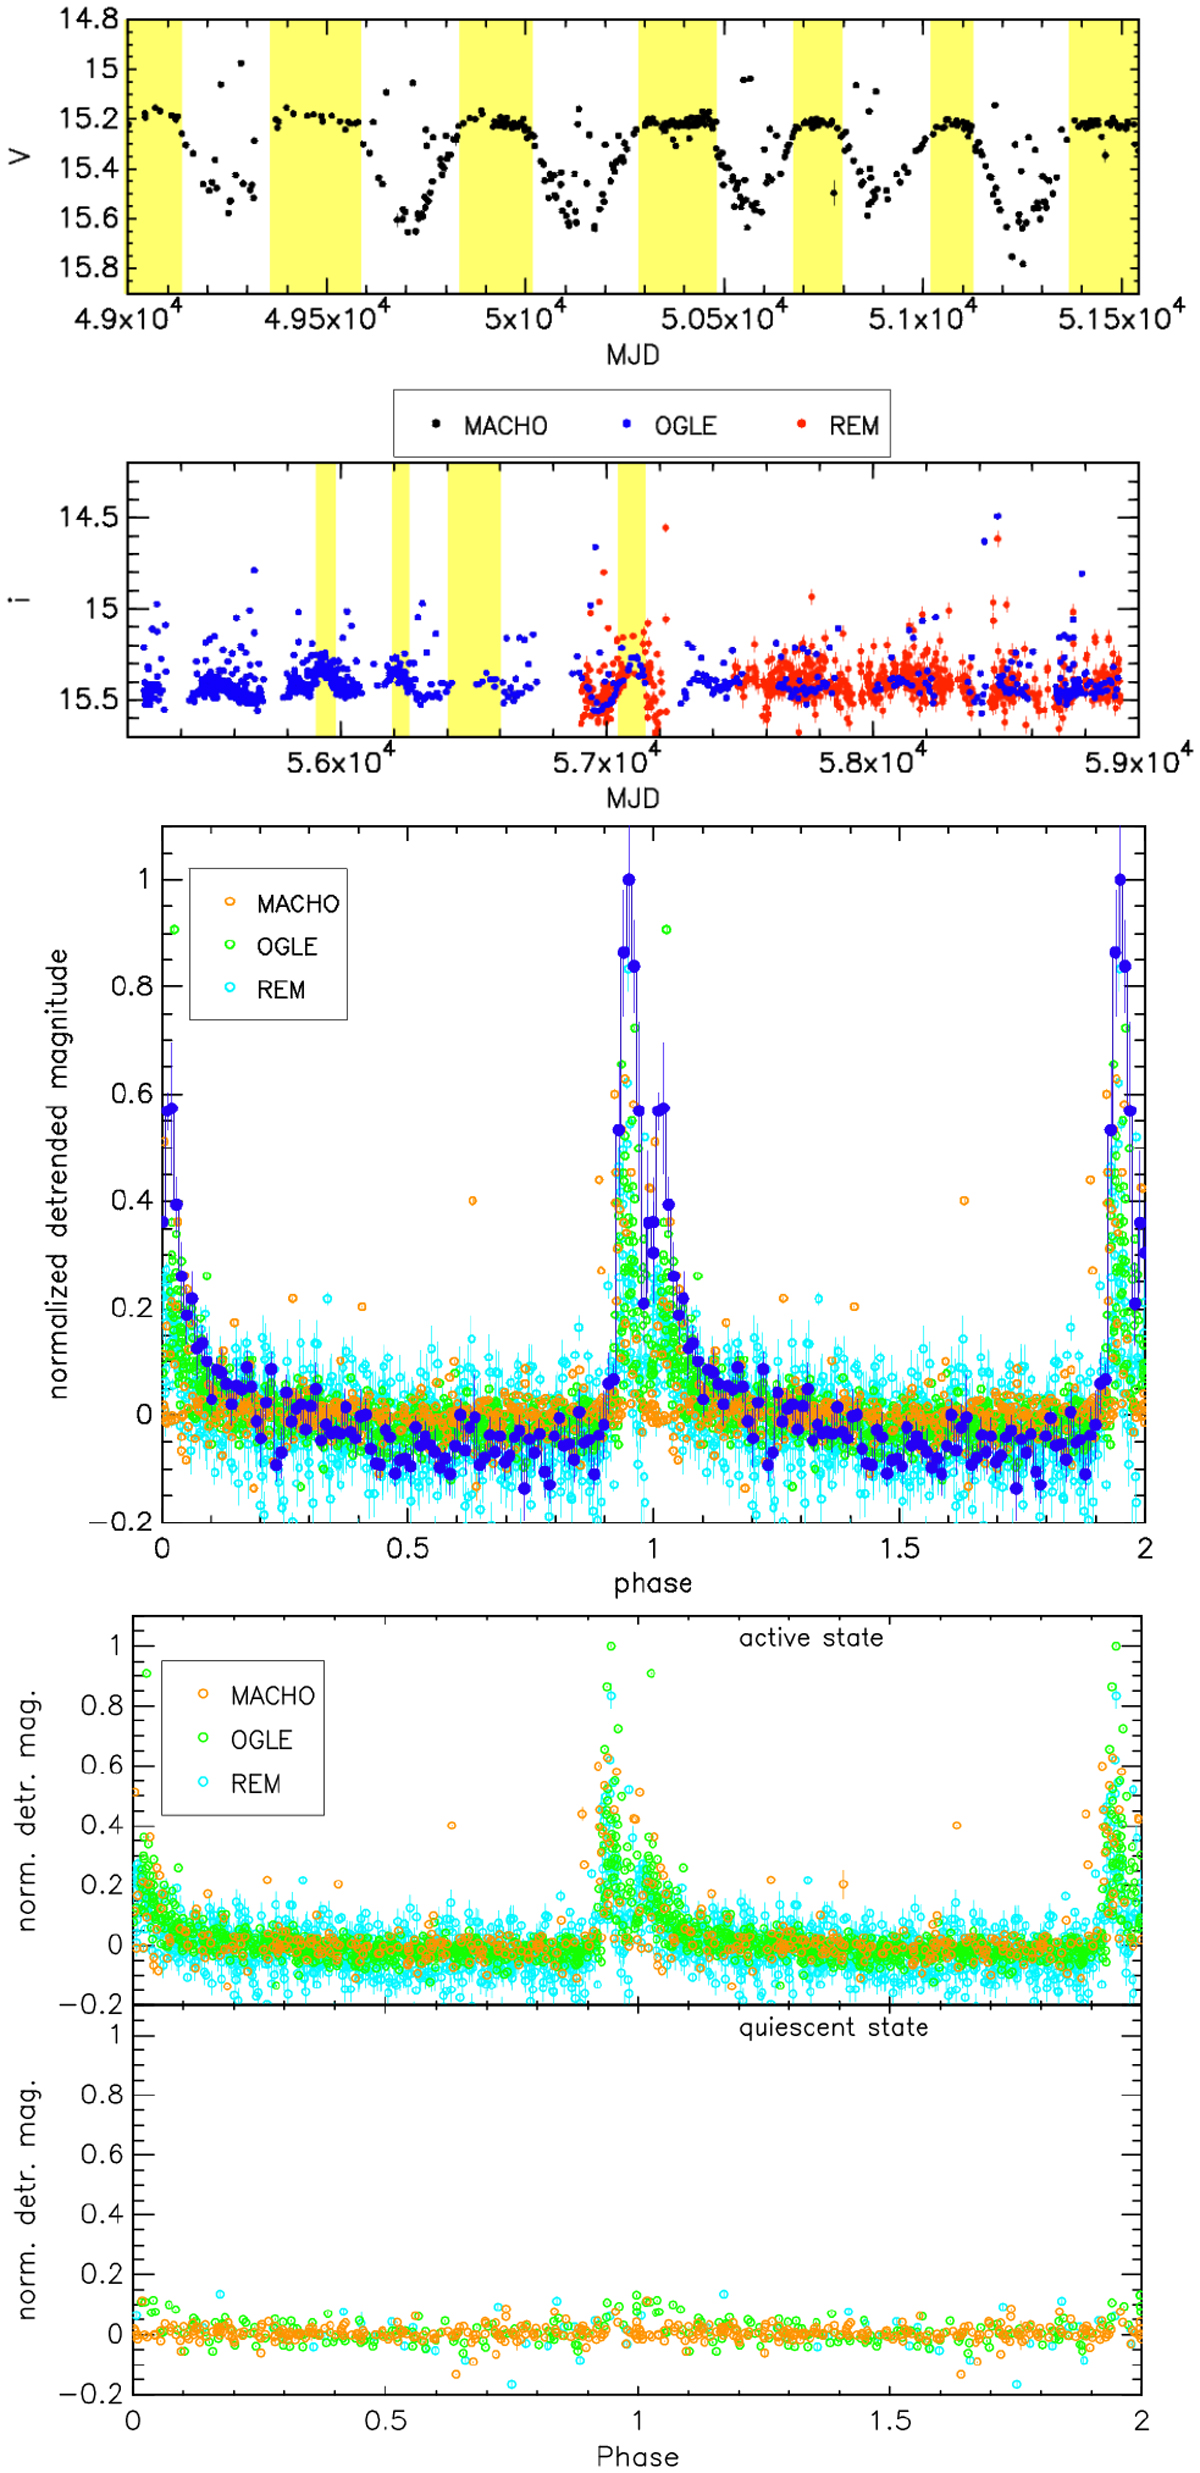
Top two panels: MACHO, OGLE, and REM light curves of A0538−66. Yellow regions show the quiescent states, when the flaring activity is absent (Alcock et al. 2001; McGowan & Charles 2003). Central panel: same data as in the upper panel, folded at the orbital period (Porb = 16.64002 d). Phase zero corresponds to the periastron passage (according to the orbital ephemeris obtained by Rajoelimanana et al. 2017). Filled blue circles show the binned light curve. Colored empty circles are the individual photometric points. Bottom panel: MACHO, OGLE, and REM light curves of A0538−66 folded at the orbital period, divided into two groups: (1) time intervals corresponding to the active state (i.e., with flaring activity and circumstellar disk) and (2) time intervals corresponding to the quiescent state (see yellow regions in the top panel). When error bars are not visible, they are smaller than the plotted symbols.
Current usage metrics show cumulative count of Article Views (full-text article views including HTML views, PDF and ePub downloads, according to the available data) and Abstracts Views on Vision4Press platform.
Data correspond to usage on the plateform after 2015. The current usage metrics is available 48-96 hours after online publication and is updated daily on week days.
Initial download of the metrics may take a while.


