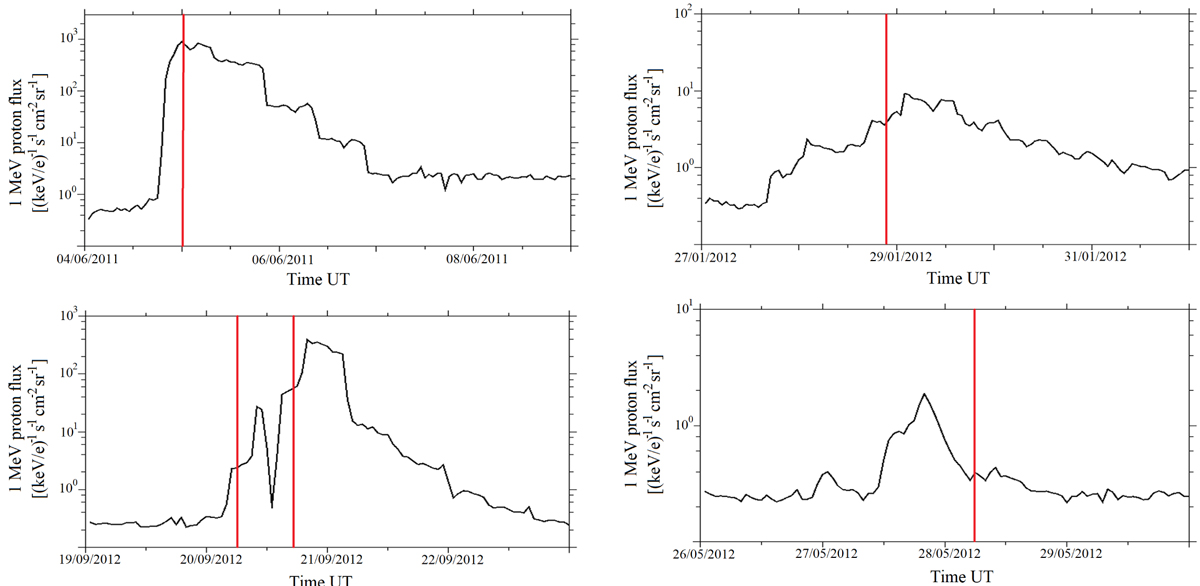
Fig. 2.
Download original image
Proton fluxes measured by EPS/MESSENGER in the energy range between 0.8 and 2 MeV on 5 June 2011 and 20 September 2012 are shown in the left panels from top to bottom. Right panels: same particle fluxes observed by EPS/MESSENGER on 27 January 2012 and 26 May 2012 from top to bottom. The vertical red line in the proton time profiles represents the CME arrival at MESSENGER (Winslow et al. 2015).
Current usage metrics show cumulative count of Article Views (full-text article views including HTML views, PDF and ePub downloads, according to the available data) and Abstracts Views on Vision4Press platform.
Data correspond to usage on the plateform after 2015. The current usage metrics is available 48-96 hours after online publication and is updated daily on week days.
Initial download of the metrics may take a while.