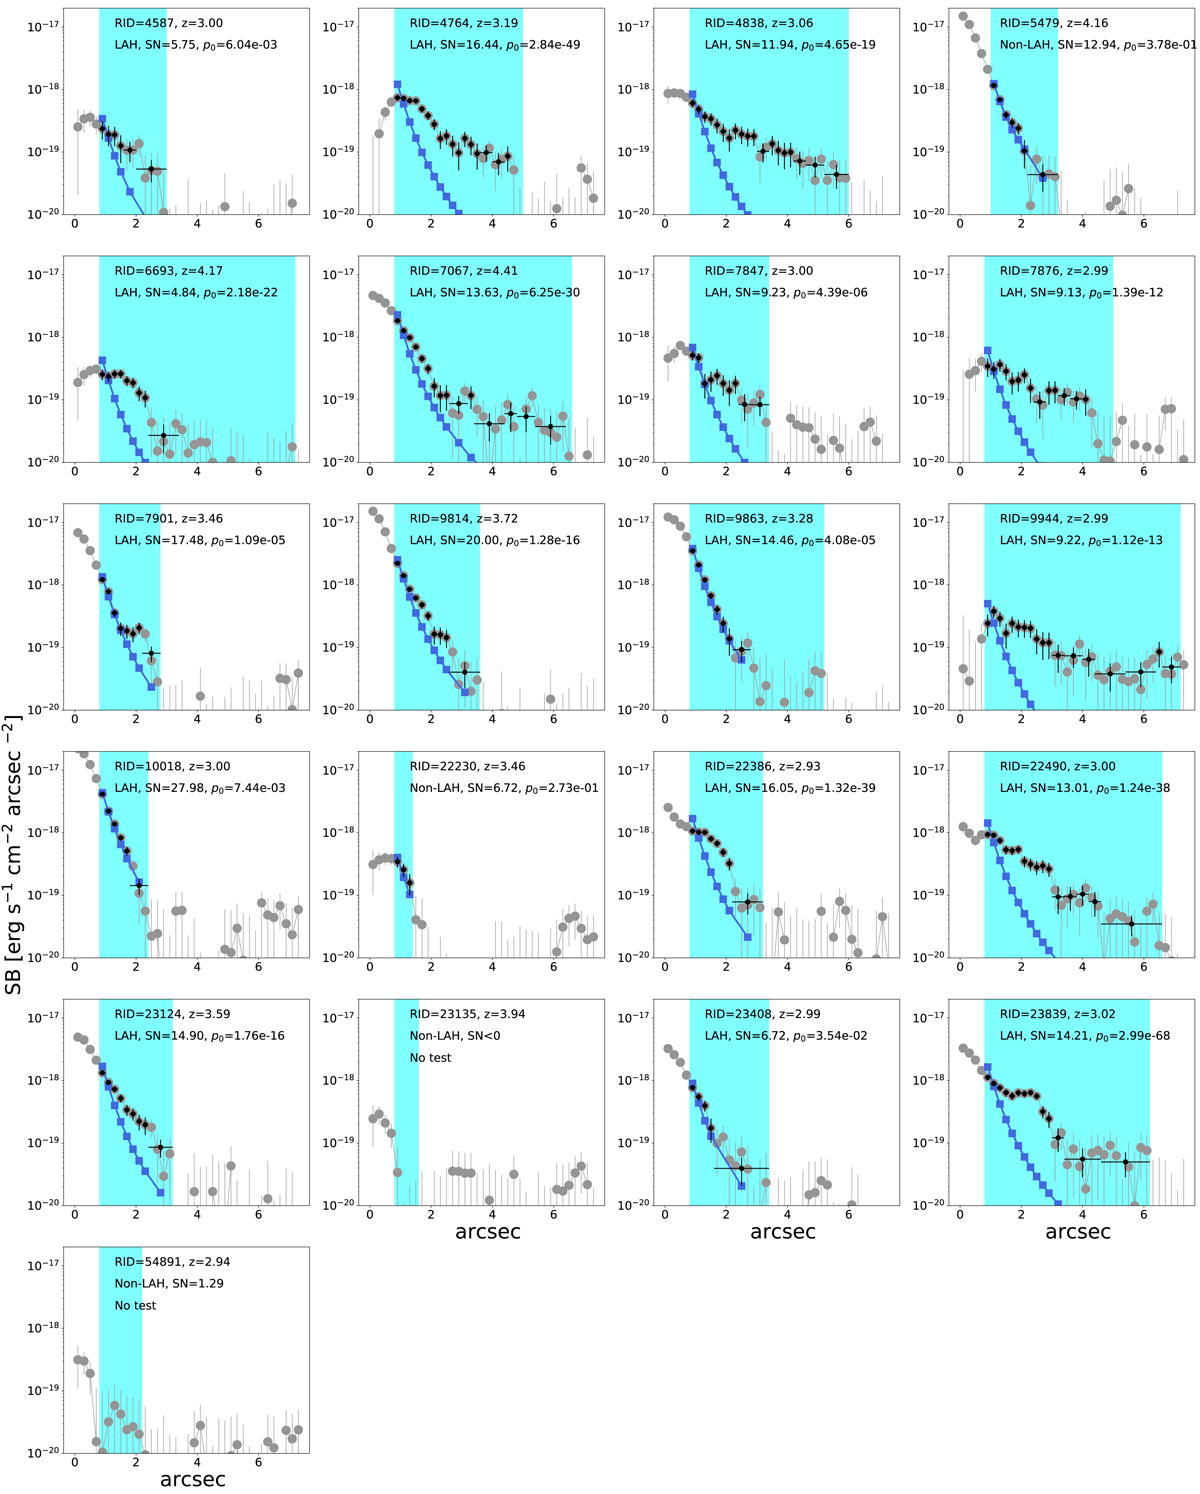
Fig. 8.
Download original image
SB profiles from the optimized NBs with results of the Lyα halo tests. The gray, black, and blue points indicate the observed radial profiles, those used for the fit (with binning if needed), and the best-fit SB profiles of the PSF-convolved continuum-like component, respectively. The x error bars of the black points mark the range for each (combined) radial bin. The cyan shaded areas represent the radial ranges, r = rin − rCoG (see Sect. 3.3). The classification of LAH or non-LAH, the S/N of the flux at r = rin − rCoG, and the probability of the null hypothesis that the SB profile at r = rin − rCoG matches that of the target’s continuum-component profile are shown at the top of each panel.
Current usage metrics show cumulative count of Article Views (full-text article views including HTML views, PDF and ePub downloads, according to the available data) and Abstracts Views on Vision4Press platform.
Data correspond to usage on the plateform after 2015. The current usage metrics is available 48-96 hours after online publication and is updated daily on week days.
Initial download of the metrics may take a while.