Fig. 7.
Download original image
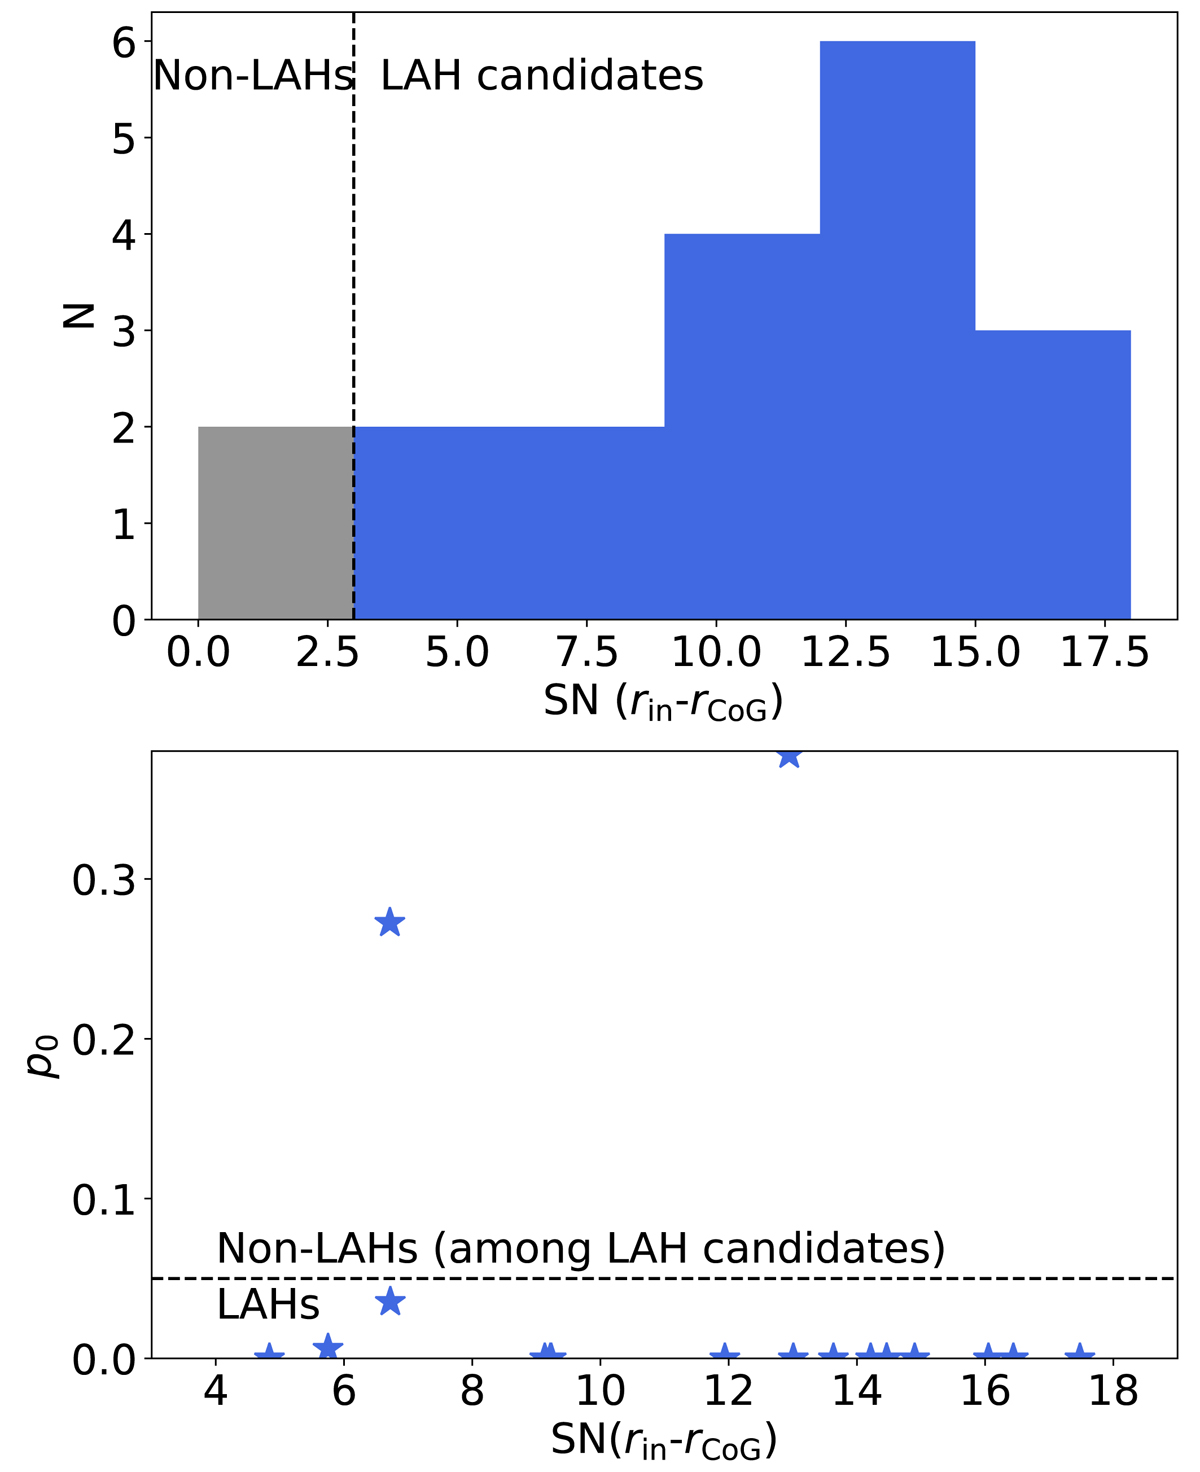
Results of the tests for the existence of a Lyα halo. Top panel: histogram of the flux S/Ns between r = rin and rCoG measured on the optimized Lyα NBs. Blue and gray histograms indicate galaxies above and below the threshold of S/N = 3 (black dashed line), Non-LAHs and LAH candidates, respectively. RID = 23135 has a negative S/N(rin − rCoG) and is counted as S/N(rin − rCoG) = 0 in the plot. Bottom panel: probability of the null hypothesis that the SB profile at r = rin − rCoG matches that of the target’s continuum-component profile vs. flux S/N between r = rin and rCoG for the LAH candidates. A black dashed line represents the border of LAHs and Non-LAHs.
Current usage metrics show cumulative count of Article Views (full-text article views including HTML views, PDF and ePub downloads, according to the available data) and Abstracts Views on Vision4Press platform.
Data correspond to usage on the plateform after 2015. The current usage metrics is available 48-96 hours after online publication and is updated daily on week days.
Initial download of the metrics may take a while.