Fig. 3.
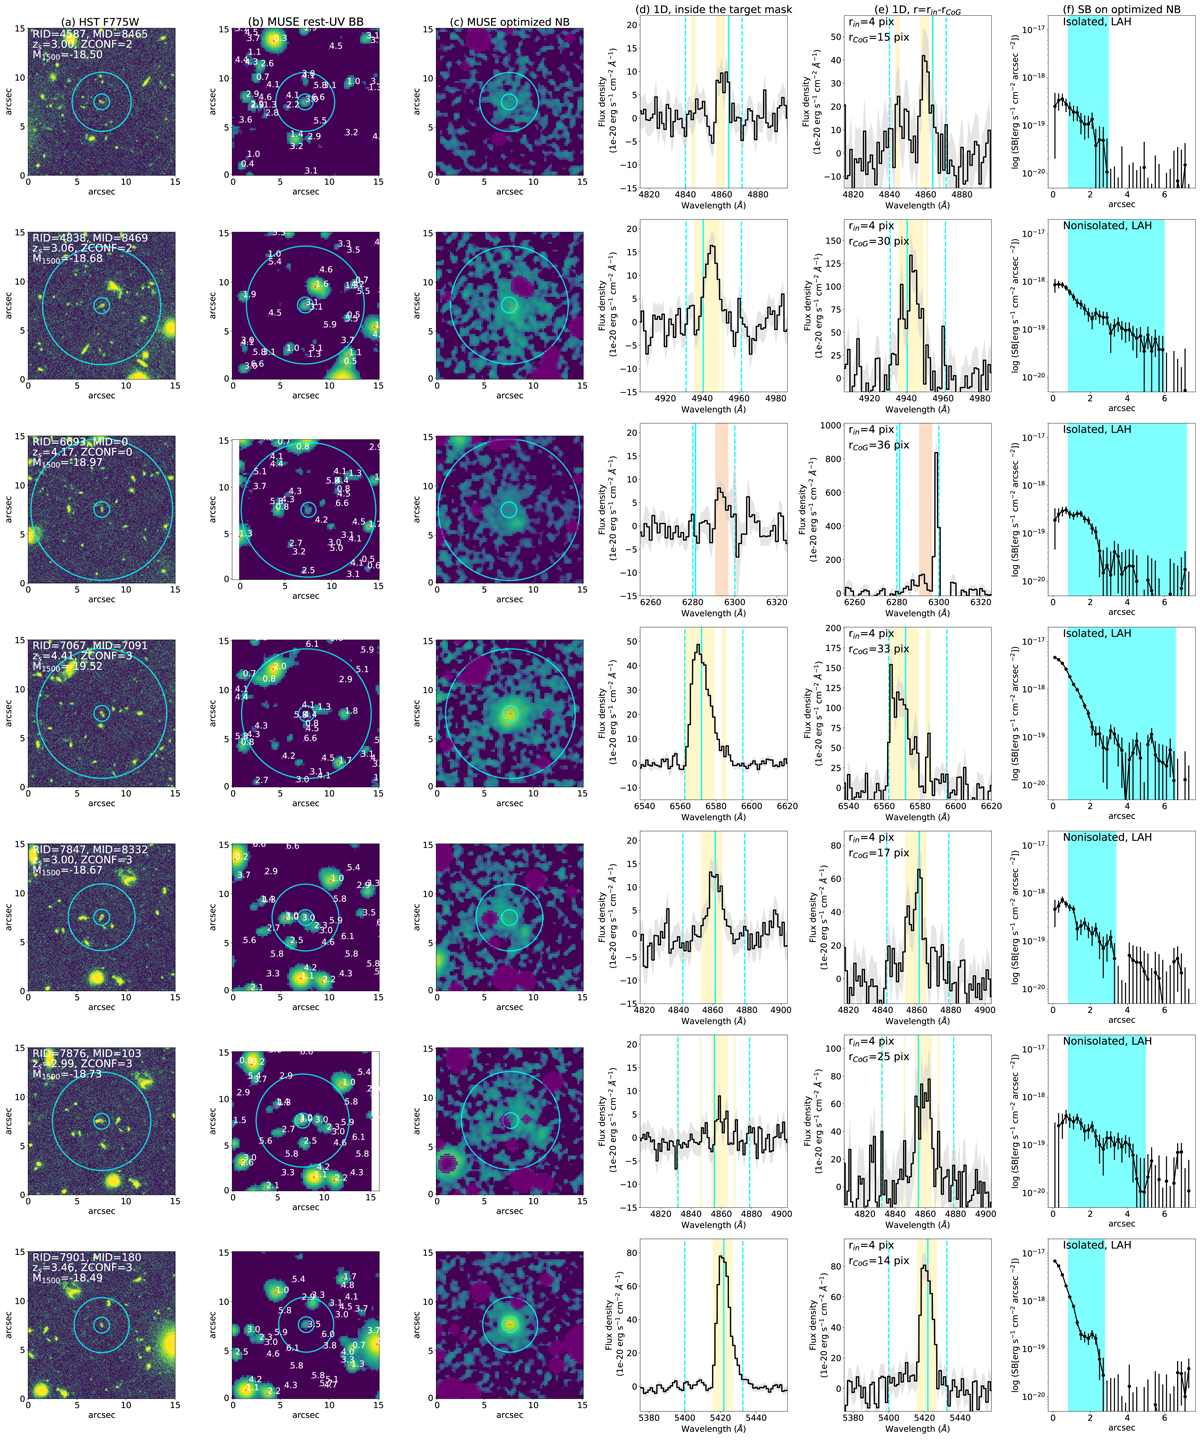
Download original image
Overview of the first 7 sources in order of RID except for RID = 4764 and 5479. Each row shows a different object. Panels a–f: are the same as those of Fig. 2. Panel a: MID = 0 means that no MUSE ID is assigned in the MXDF catalog (i.e., ZCONF = 0). Panels d and e: the spectral slices used to produce the optimized NB are indicated by the yellow and orange shaded areas for sources with high S/N spectral slices at r = rin − rCoG and those with low S/N spectral slices at r = rin − rCoG, respectively (see Sect. 3.2). We note that the emission ring shown in the NB of RID = 7876 is caused by the mask for a source with extended emission. Since the ring is located outside rCoG, it does not affect our results.
Current usage metrics show cumulative count of Article Views (full-text article views including HTML views, PDF and ePub downloads, according to the available data) and Abstracts Views on Vision4Press platform.
Data correspond to usage on the plateform after 2015. The current usage metrics is available 48-96 hours after online publication and is updated daily on week days.
Initial download of the metrics may take a while.