Fig. D.3.
Download original image
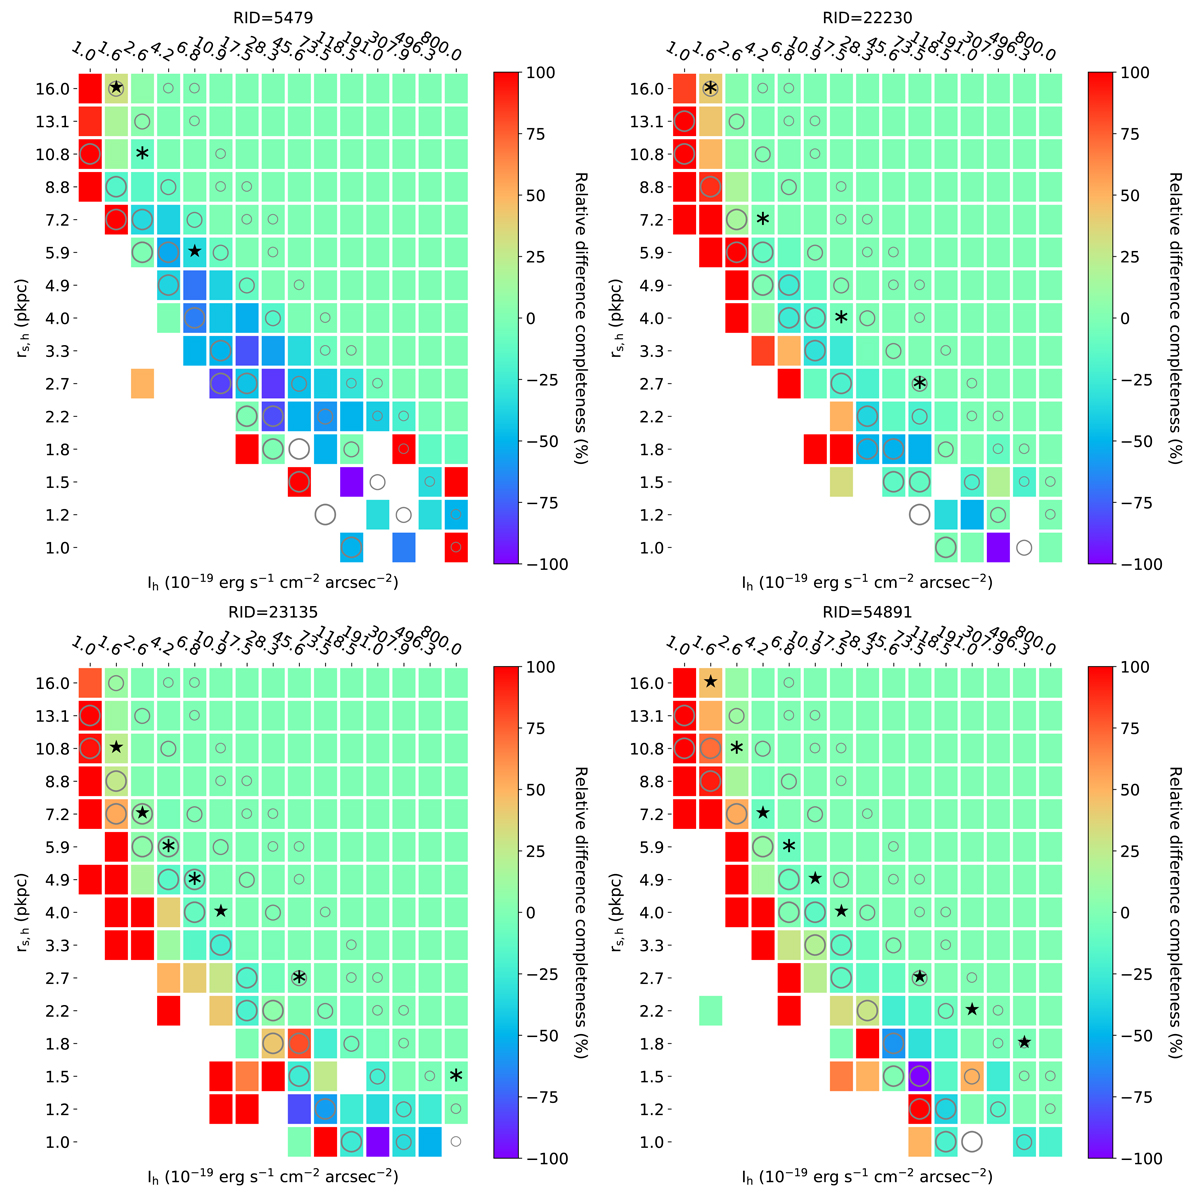
Heat map of the relative difference in the completeness for four non-LAHs on the diagram of Ih and rs, h of halo models. The relative difference in completeness is defined as (![]() )/
)/![]() , where
, where ![]() and
and ![]() are the completeness for halo and continuum-like model, and that for halo only model, respectively. The heat map gets white when the relative difference is not available (
are the completeness for halo and continuum-like model, and that for halo only model, respectively. The heat map gets white when the relative difference is not available (![]() ) or
) or ![]() . Black stars and asterisks on the map indicate the halo parameter sets that have completeness values for halo models from 45% to 54% and those from 54% to 70%, respectively, while gray large, middle-size, and small circles represent the parameter sets whose Lyα fluxes of the halo models are from 1 × 10⁻¹⁸ erg s−1 cm−2 to 2 × 10⁻¹⁸ erg s−1 cm−2, those from 4 × 10⁻¹⁸ erg s−1 cm−2 to 6 × 10⁻¹⁸ erg s−1 cm−2, and those from 1 × 10⁻¹⁷ erg s−1 cm−2 to 2 × 10⁻¹⁷ erg s−1 cm−2, respectively.
. Black stars and asterisks on the map indicate the halo parameter sets that have completeness values for halo models from 45% to 54% and those from 54% to 70%, respectively, while gray large, middle-size, and small circles represent the parameter sets whose Lyα fluxes of the halo models are from 1 × 10⁻¹⁸ erg s−1 cm−2 to 2 × 10⁻¹⁸ erg s−1 cm−2, those from 4 × 10⁻¹⁸ erg s−1 cm−2 to 6 × 10⁻¹⁸ erg s−1 cm−2, and those from 1 × 10⁻¹⁷ erg s−1 cm−2 to 2 × 10⁻¹⁷ erg s−1 cm−2, respectively.
Current usage metrics show cumulative count of Article Views (full-text article views including HTML views, PDF and ePub downloads, according to the available data) and Abstracts Views on Vision4Press platform.
Data correspond to usage on the plateform after 2015. The current usage metrics is available 48-96 hours after online publication and is updated daily on week days.
Initial download of the metrics may take a while.