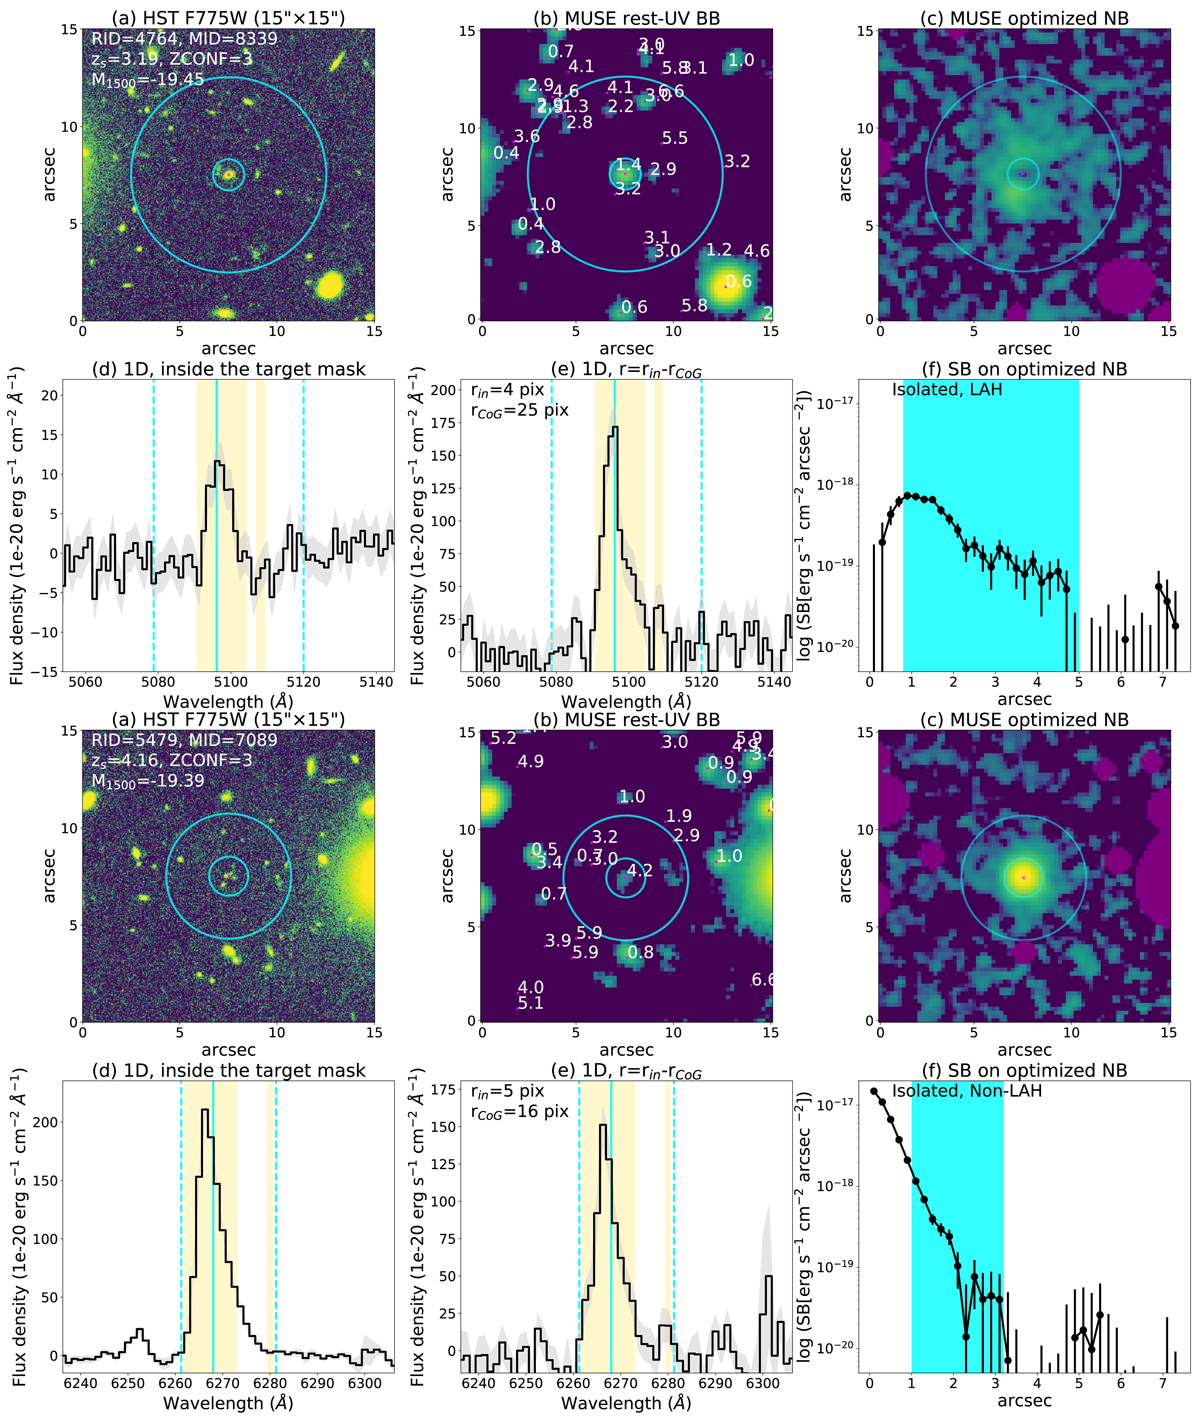
Fig. 2.
Download original image
Examples of the overview with two sources (a LAH RID = 4764 and a non-LAH RID = 5479). The first two rows show RID = 4764, while the last two rows show RID = 5479. (a) HST F775W image (rest-frame UV). The Rafelski’s ID (RID), the MUSE ID (MID), zs, ZCONF, and M1500 are indicated. The smaller and larger cyan circles present rin and rCoG (Sects. 3.1 and 3.2). (b) MUSE broad band image summed over the rest-frame UV range 1300–1800 Å. The image is smoothed with a 2D Gaussian filter with a standard deviation of 1 pixel. Spectroscopic redshifts of sources in the MXDF catalog in the minicube are indicated. (c) Optimized narrow band for Lyα with the neighboring object mask (purple areas). The image is smoothed with a 2D Gaussian filter with a standard deviation of 1 pixel. The white contours indicate a SB of 2 × 10⁻¹⁹ erg s−1 cm−2 arcsec−2. (d) 1D spectrum around the wavelength of Lyα extracted inside the target’s continuum-component mask. The spectra and the 1σ uncertainty are represented by the black line and the gray shaded area, respectively. The spectral width of the flux-maximized NB and the wavelength of Lyα converted from zs in the MXDF catalog are shown by the cyan dashed and solid lines, respectively. The spectral slices used to produce the optimized NB are indicated by the yellow shaded areas for sources with high S/N spectral slices at r = rin − rCoG. (e) 1D spectrum around the wavelength of Lyα extracted in r = rin − rCoG. (f) Radial SB profile of Lyα emission in log scale measured on the optimized NB image. The cyan shaded areas represent the radial range, r = rin − rCoG (see Sect. 3.3). The panel shows whether the source is an isolated or nonisolated object, and whether it is a Lyα halo (LAH) or non-LAH. All images are 15 arcsec each on a side. We note that the segmentation maps and the masks as well as zoomed-in HST F775W cutouts (4″ × 4″) are shown in Figs. C.1 and C.2.
Current usage metrics show cumulative count of Article Views (full-text article views including HTML views, PDF and ePub downloads, according to the available data) and Abstracts Views on Vision4Press platform.
Data correspond to usage on the plateform after 2015. The current usage metrics is available 48-96 hours after online publication and is updated daily on week days.
Initial download of the metrics may take a while.