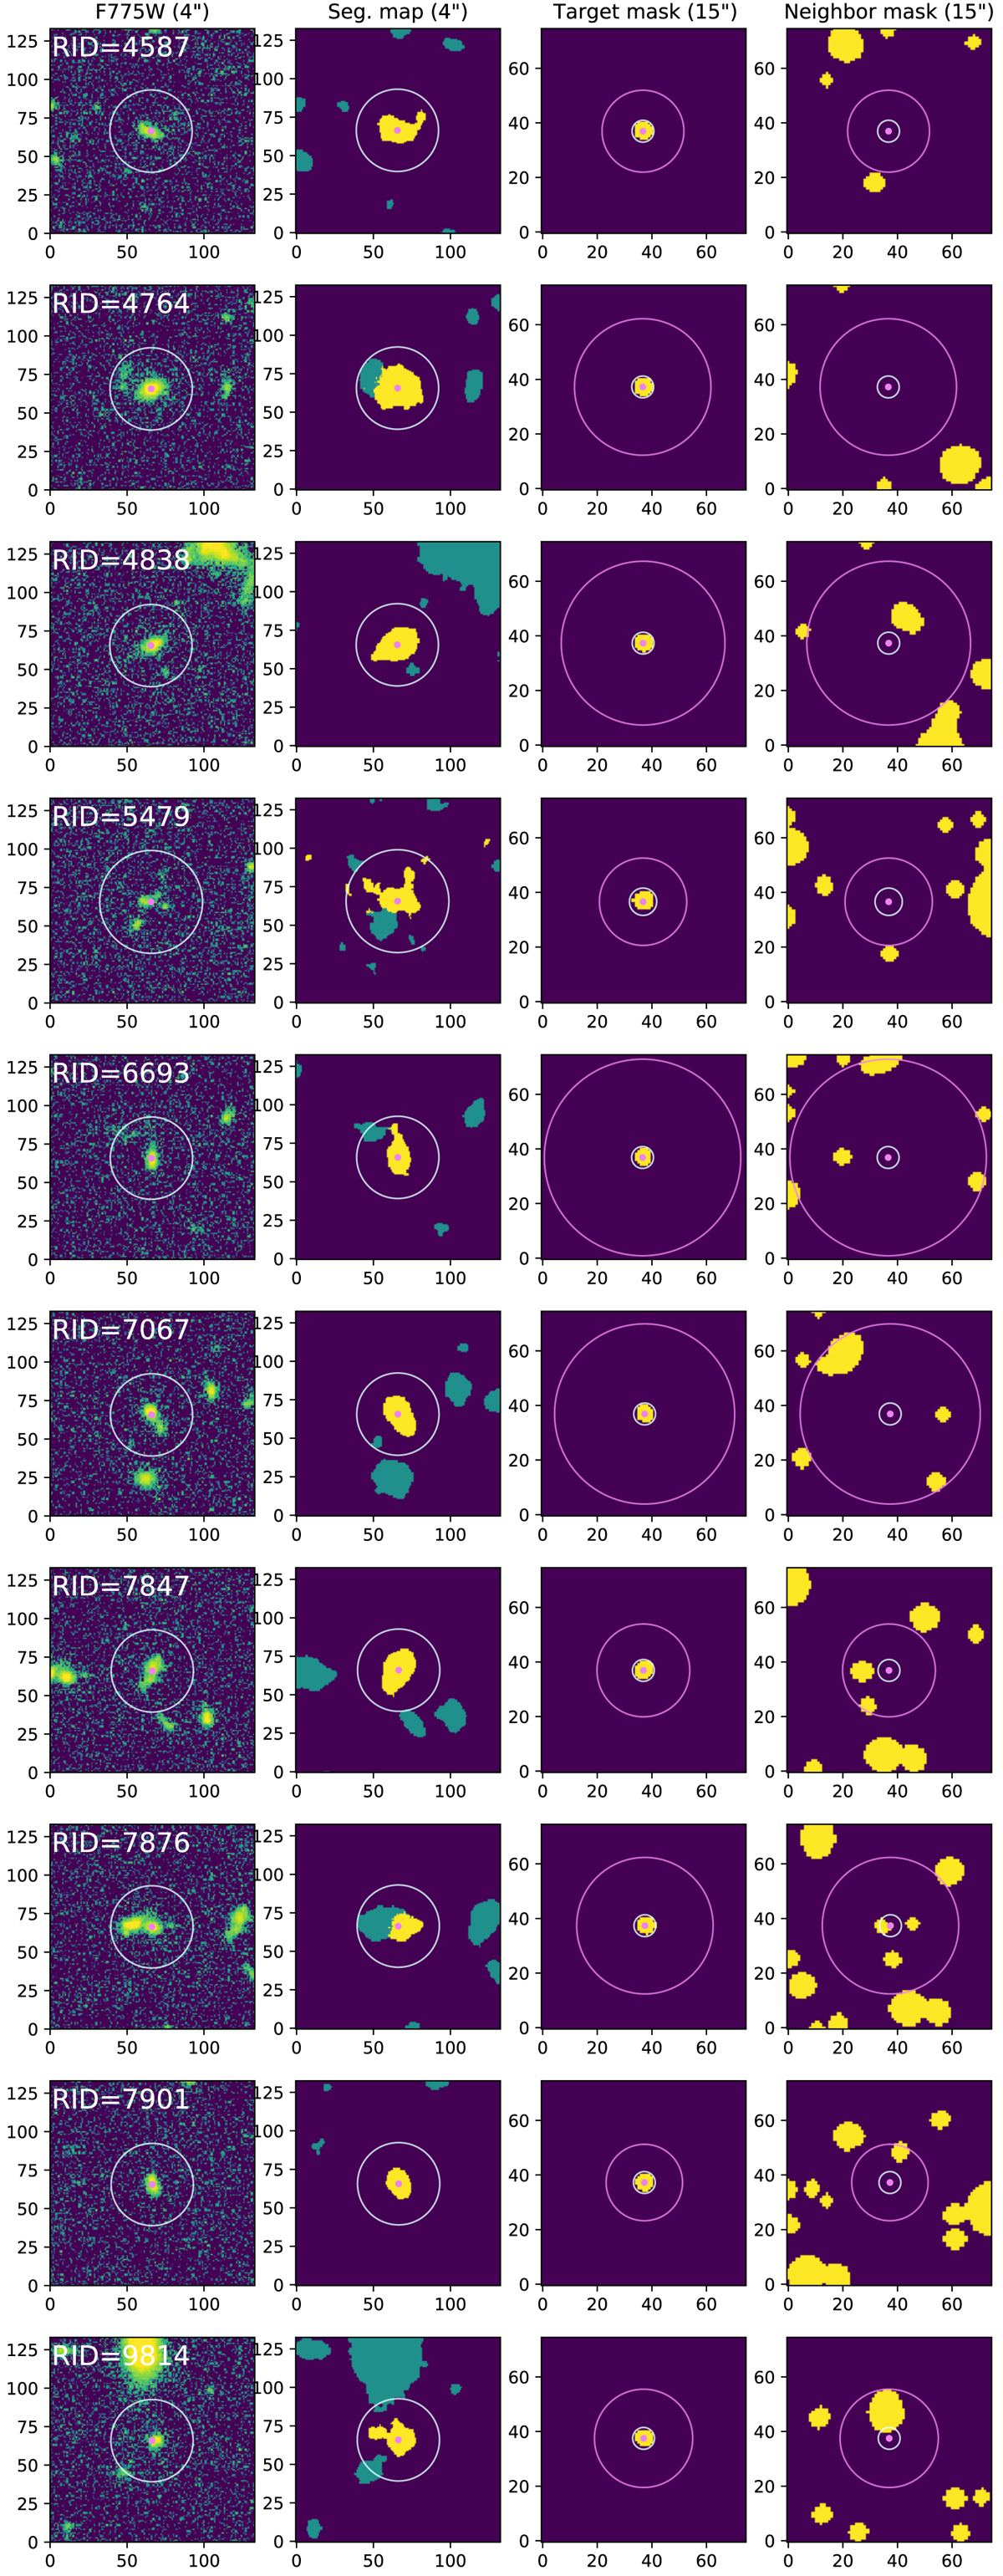
Fig. C.1.
Download original image
HST cutouts, segmentation maps, and masks for the first 10 sources in order of RID. First column: 4″ × 4″ HST F775W cutout images. The purple dots and circles represent the positions of the UV-selected galaxy and rin, respectively. Second column: 4″ × 4″ cutouts of the HST segmentation map. The yellow and green regions indicate the areas in which the target and neighboring galaxies are detected on the HST images, respectively. The segmentation map gives the boundaries of the objects. The dark purple regions indicate the sky. Third column: target’s continuum-component masks (in the spatial resolution of MUSE, 15″ × 15″). The yellow and dark purple regions present the mask (the area of the main part of the galaxy) and the sky, respectively. The violet circles show rCoG. Fourth column: Neighboring object masks (neighbor mask; in the spatial resolution of MUSE, 15″ × 15″). The yellow and dark purple regions present the mask (the area of the main part of neighboring galaxies that have a bright continuum) and the sky, respectively.
Current usage metrics show cumulative count of Article Views (full-text article views including HTML views, PDF and ePub downloads, according to the available data) and Abstracts Views on Vision4Press platform.
Data correspond to usage on the plateform after 2015. The current usage metrics is available 48-96 hours after online publication and is updated daily on week days.
Initial download of the metrics may take a while.