Fig. A.2.
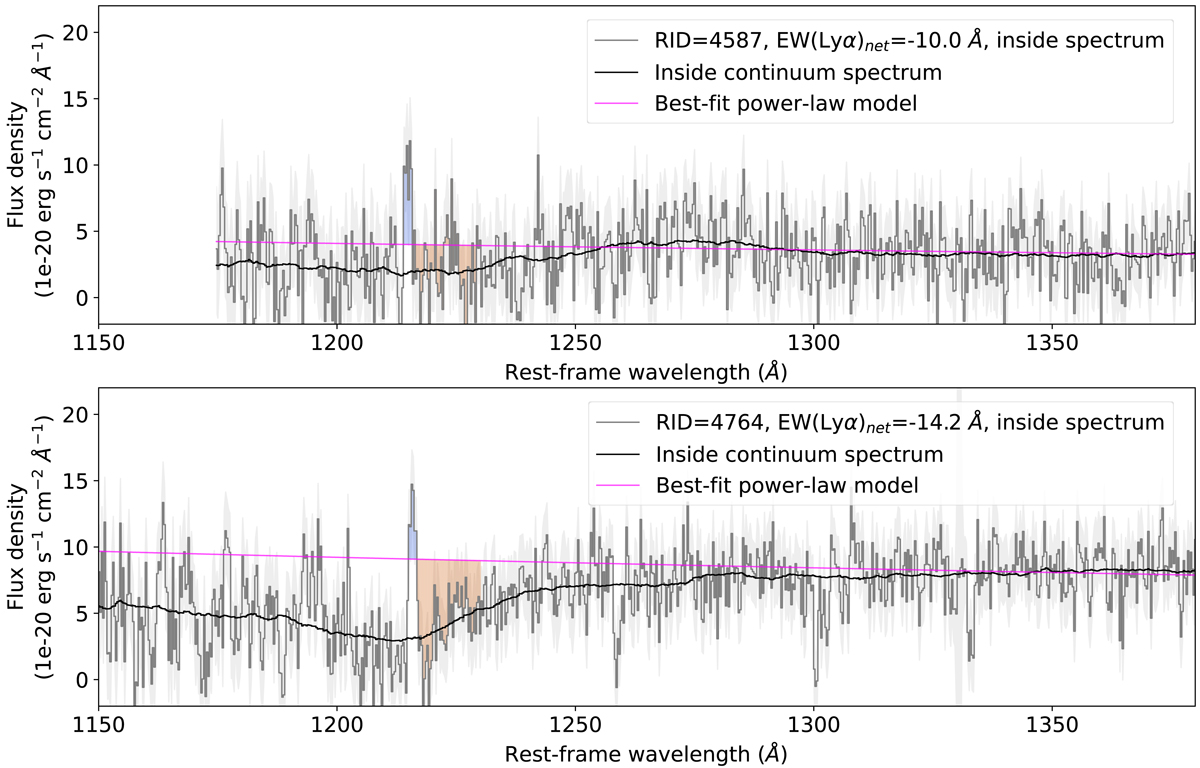
Download original image
1D spectra of the two non-LAEs with LAHs, RID = 4587 and 4764 discussed in Section 3.3.3, as examples of our inside spectra. The dark gray lines, the faint gray shaded areas, the black lines, and the magenta lines show the inner spectra, its 1σ uncertainties, the inner continuum spectra, and the best-fit power-law models for the continua, respectively. The blue and orange shaded areas indicate fluxes integrated for the Lyα emission and Lyα absorption measurements (the spectral windows, see Appendix A.3 for more details), respectively. We note that the Lyα absorption flux (more precisely, the upper limit of the absorption flux) was obtained by multiplying two to the integrated flux in the orange shaded spectral window.
Current usage metrics show cumulative count of Article Views (full-text article views including HTML views, PDF and ePub downloads, according to the available data) and Abstracts Views on Vision4Press platform.
Data correspond to usage on the plateform after 2015. The current usage metrics is available 48-96 hours after online publication and is updated daily on week days.
Initial download of the metrics may take a while.